generate data:
x=rnorm(1000,mean=0)

y=rnorm(1000,mean=10)

obs1=data.frame(rbind(cbind(rnorm(1000),rnorm(1000)),cbind(rnorm(1000,mean=10),rnorm(1000,mean=10))),as.factor("Class A"))

obs2=data.frame(rbind(cbind(x,y),cbind(y,x)),as.factor("Class B"))

colnames(obs1) = c("x", "y", "class")

colnames(obs2) = c("x", "y", "class")

df=rbind(obs1,obs2)
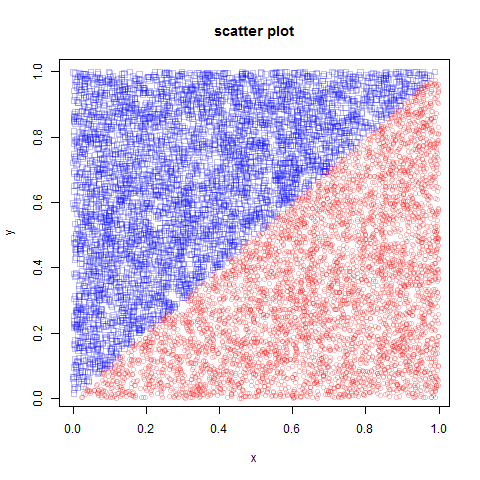
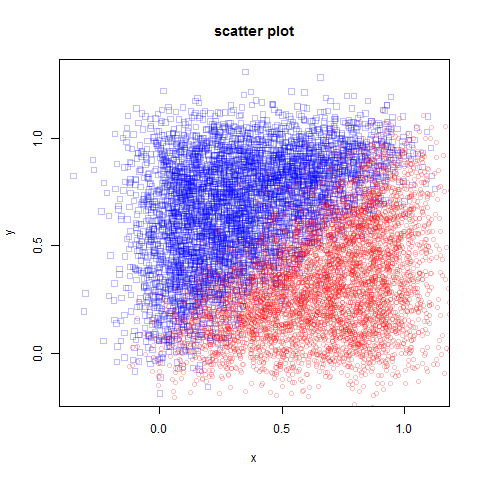
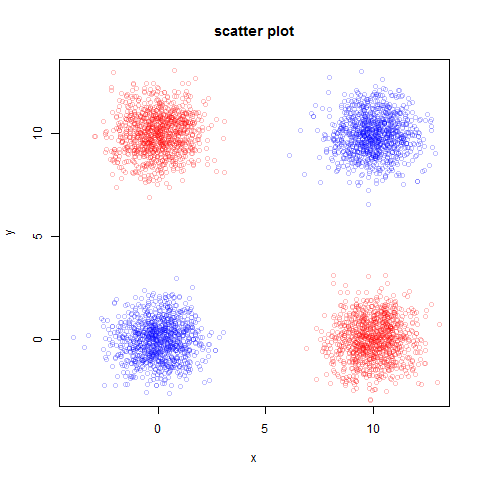
make scatter plot:
#scatter plot

#dev.new()

png(file="scatter.png")

plot(obs1$x,obs1$y,col=colors[[1]],xlab="x",ylab="y",main="scatter plot")

points(obs2$x,obs2$y,col=colors[[2]])

dev.off()
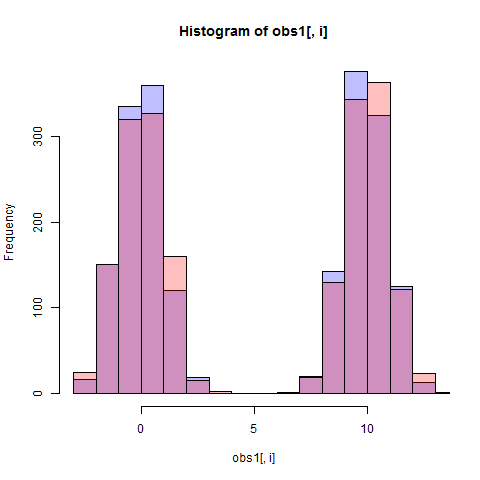
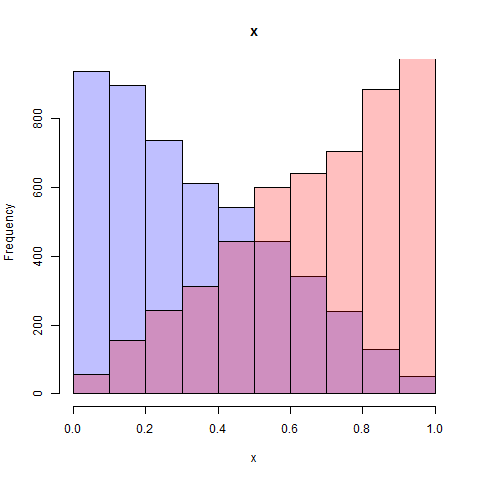
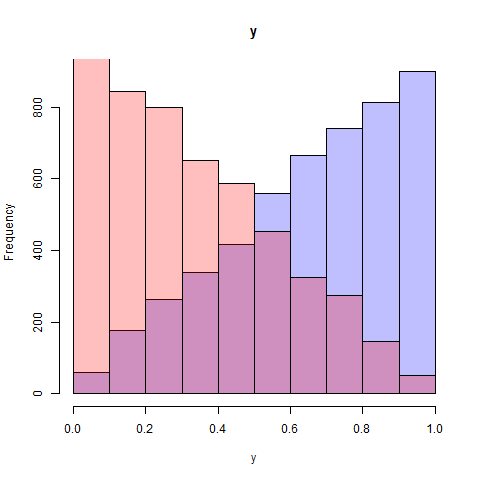
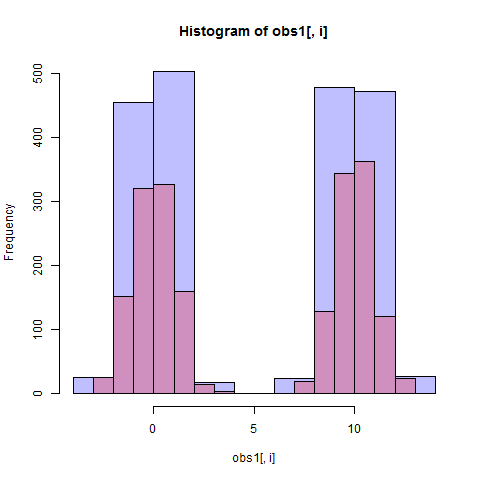
see histograms:
for(i in 1:2)

{

	#dev.new()

	png(file=paste("hist-",names[[i]],".png",sep=""))

	hist(obs1[,i],col=colors[[1]])

	hist(obs2[,i],col=colors[[2]],add=TRUE)

	legend(2000,9.5, c("Class A","Class B"))

	dev.off()

}

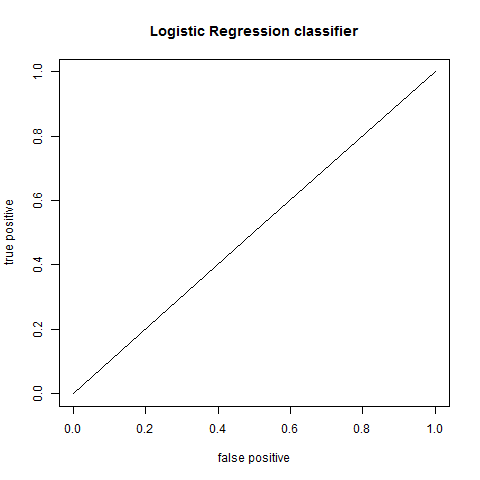
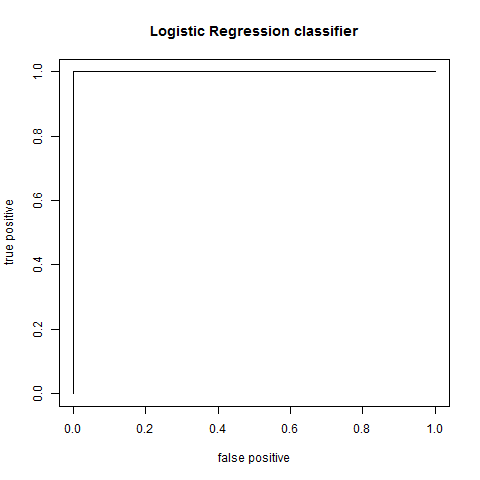
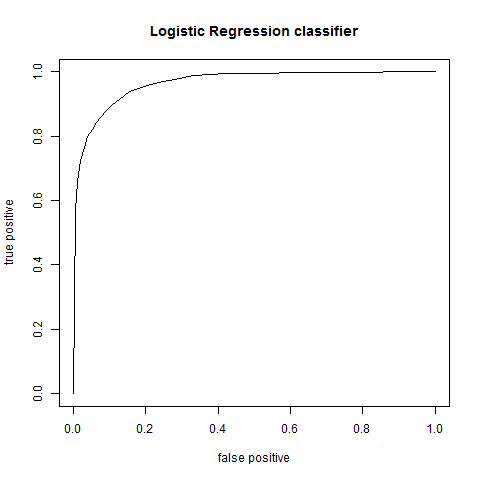
build classifier:
model=glm(class~.,family="binomial",data=df)

response=predict(model,type="response")

M=NULL

for (threshold in seq(0.01,0.99,0.01))

{

	M=cbind(M,calc(response,df[,3],levels(df[,3]),threshold))

}

M = cbind(c(1,1),M,c(0,0))

fp = M[1,]

tp = M[2,]

auc = -auc(fp, tp)

#dev.new()

png(file="roc.png")

plot(fp,tp,type="l",xlab="false positive",ylab="true positive",main="Logistic Regression classifier")

#lines(c(0,0),c(1,1))

dev.off()

full code:
colors = list(rgb(0,0,1,1/4),rgb(1,0,0,1/4))
x=rnorm(1000,mean=0)
y=rnorm(1000,mean=10)
obs1=data.frame(rbind(cbind(rnorm(1000),rnorm(1000)),cbind(rnorm(1000,mean=10),rnorm(1000,mean=10))),as.factor("Class A"))
obs2=data.frame(rbind(cbind(x,y),cbind(y,x)),as.factor("Class B"))
colnames(obs1) = c("x", "y", "class")
colnames(obs2) = c("x", "y", "class")
df=rbind(obs1,obs2)
#scatter plot
#dev.new()
png(file="scatter.png")
plot(obs1$x,obs1$y,col=colors[[1]],xlab="x",ylab="y",main="scatter plot")
points(obs2$x,obs2$y,col=colors[[2]])
dev.off()

Dp=D(as.matrix(obs1[,1:2]),as.matrix(obs2[,1:2]))
names=c("x","y")
for(i in 1:2)
{
	#dev.new()
	png(file=paste("hist-",names[[i]],".png",sep=""))
	hist(obs1[,i],col=colors[[1]])
	hist(obs2[,i],col=colors[[2]],add=TRUE)
	legend(2000,9.5, c("Class A","Class B"))
	dev.off()
}

model=glm(class~.,family="binomial",data=df)
response=predict(model,type="response")
M=NULL
for (threshold in seq(0.01,0.99,0.01))
{
	M=cbind(M,calc(response,df[,3],levels(df[,3]),threshold))
}
M = cbind(c(1,1),M,c(0,0))
fp = M[1,]
tp = M[2,]
auc = -auc(fp, tp)
#dev.new()
png(file="roc.png")
plot(fp,tp,type="l",xlab="false positive",ylab="true positive",main="Logistic Regression classifier")
#lines(c(0,0),c(1,1))
dev.off()