Measuring performance of BigQuery vs. Clickhouse

This post summarizes results of a performance test to compare BigQuery vs. Clickhouse – two high-performance analytics databases. Later on I performed same tests on DuckDB but as we shall see it cannot compete with CH or BQ so main focus will be on BQ vs CH.

Methodology

Star Schema Benchmark was used for the test. dbgen tool (commit 0741e06d4c3e811bcec233378a39db2fc0be5d79) was run with a SF of 333 to generate the dataset. Here are the details:

Table# of rows
customer.tbl9,990,000
supplier.tbl666,000
part.tbl1,800,000
date.tbl2,556
lineorder.tbl1,997,997,687

All in all this generated about 225 GB of data. Clickhouse loaded all the 2B rows in an impressive 30 min time period.

$ time clickhouse-client --password --query "INSERT INTO ssb.lineorder FORMAT CSV" < /app/ssb-data/lineorder.tbl
Password for user (default):

real	29m56.227s
user	94m10.616s
sys	5m7.183s

After this the queries described at [1] were run on BigQuery and Clickhouse. In case of BigQuery, the SQL code needs to be adapted as follows:

ClickhouseBigQueryDuckDB
PARTITION BY toYear(LO_ORDERDATE)partition by date_trunc(lo_orderdate, year)partition clause is not supported while creating table
ORDER BY (LO_ORDERDATE, LO_ORDERKEY)cluster BY LO_ORDERDATE, LO_ORDERKEYorder by clause is not supported while creating table
toYear(LO_ORDERDATE) = 1993extract(year from LO_ORDERDATE) = 1993extract(year from LO_ORDERDATE) = 1993
toISOWeek(LO_ORDERDATE) = 6extract(ISOWeek from LO_ORDERDATE) = 6week(LO_ORDERDATE) = 6
toYYYYMM(LO_ORDERDATE) = 199712extract(year from LO_ORDERDATE) = 1997 and extract(month from LO_ORDERDATE) = 12extract(year from LO_ORDERDATE) = 1997 and extract(month from LO_ORDERDATE) = 12

The first thing which impressed me is that the raw CSV lineorder table measured 239,234,458,925 bytes but it got reduced to 57 GB when ingested into Clickhouse and 48 GB in case of BigQuery

Lineorder table in BigQuery

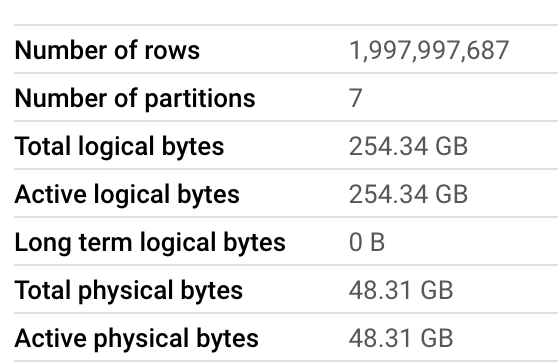
The denormalized lineorder_flat table has following stats in BQ:

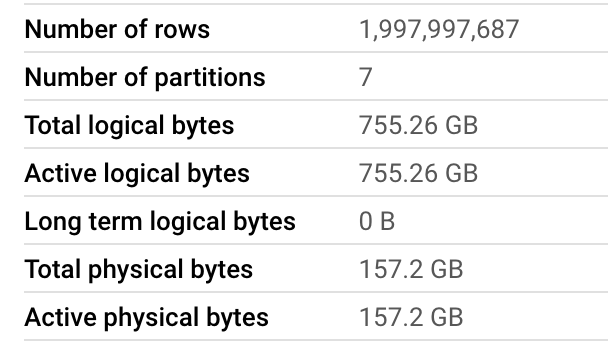
In case of Clickhouse, running this script gave us:

┌─parts.database─┬─parts.table─────────────┬───────rows─┬─latest_modification─┬─disk_size──┬─primary_keys_size─┬─engine────┬───bytes_size─┬─compressed_size─┬─uncompressed_size─┬────────────────ratio─┐
│ ssb            │ lineorder_flat          │ 1997997687 │ 2022-10-15 01:13:59 │ 178.38 GiB │ 1.40 MiB          │ MergeTree │ 191538385255 │ 178.09 GiB      │ 323.22 GiB        │   0.5510020049576446 │
│ ssb            │ lineorder               │ 1997997687 │ 2022-10-17 05:22:17 │ 55.59 GiB  │ 1.40 MiB          │ MergeTree │  59685552796 │ 55.47 GiB       │ 80.01 GiB         │    0.693277565266494 │
│ ssb            │ customer                │    9990000 │ 2022-10-14 02:26:59 │ 382.37 MiB │ 4.79 KiB          │ MergeTree │    400943880 │ 382.03 MiB      │ 562.22 MiB        │   0.6795006124121903 │
│ system         │ trace_log               │    3652777 │ 2022-10-17 17:46:08 │ 58.67 MiB  │ 2.69 KiB          │ MergeTree │     61520620 │ 58.15 MiB       │ 1.06 GiB          │  0.05349937527433843 │
│ ssb            │ part                    │    1800000 │ 2022-10-14 02:27:57 │ 31.03 MiB  │ 892.00 B          │ MergeTree │     32541446 │ 30.96 MiB       │ 44.07 MiB         │   0.7024153306907351 │
│ system         │ asynchronous_metric_log │   78135224 │ 2022-10-17 17:46:13 │ 28.09 MiB  │ 95.36 KiB         │ MergeTree │     29458819 │ 26.76 MiB       │ 1.10 GiB          │  0.02382792149791971 │
│ system         │ metric_log              │     295379 │ 2022-10-17 17:46:09 │ 27.12 MiB  │ 696.00 B          │ MergeTree │     28442229 │ 25.86 MiB       │ 1.02 GiB          │ 0.024746974449290835 │
│ ssb            │ supplier                │     666000 │ 2022-10-14 02:28:33 │ 25.10 MiB  │ 332.00 B          │ MergeTree │     26323607 │ 25.08 MiB       │ 36.85 MiB         │   0.6807884856313037 │
│ system         │ part_log                │      35368 │ 2022-10-17 06:14:37 │ 1.36 MiB   │ 48.00 B           │ MergeTree │      1425397 │ 0.00 B          │ 0.00 B            │                  nan │
│ system         │ query_log               │        110 │ 2022-10-17 17:45:46 │ 39.87 KiB  │ 24.00 B           │ MergeTree │        40827 │ 0.00 B          │ 0.00 B            │                  nan │
└────────────────┴─────────────────────────┴────────────┴─────────────────────┴────────────┴───────────────────┴───────────┴──────────────┴─────────────────┴───────────────────┴──────────────────────┘

This is commendable and a result of column compression done by both databases.

Results

Without much ado, here is the time taken by both databases on the 13 queries in the Star Schema Benchmark.

BigQuery (s)ClickHouse (s)DuckDB (s)
Q1.11.3155.99152.67
Q1.21.2510.46050.83
Q1.31.6370.10847.87
Q2.12.50733.76770.74
Q2.22.3869.57957.43
Q2.31.7288.48254.77
Q3.12.36715.77963.03
Q3.23.4213.69064.79
Q3.34.0569.46652.34
Q3.41.7770.15850.22
Q4.12.47925.27674.31
Q4.22.0944.94586.21
Q4.32.2133.87479.24
Time taken by BigQuery and ClickHouse to execute queries in the Star Schema Benchmark. DuckDB results are also shown.
Execution time of BigQuery vs. Clickhouse

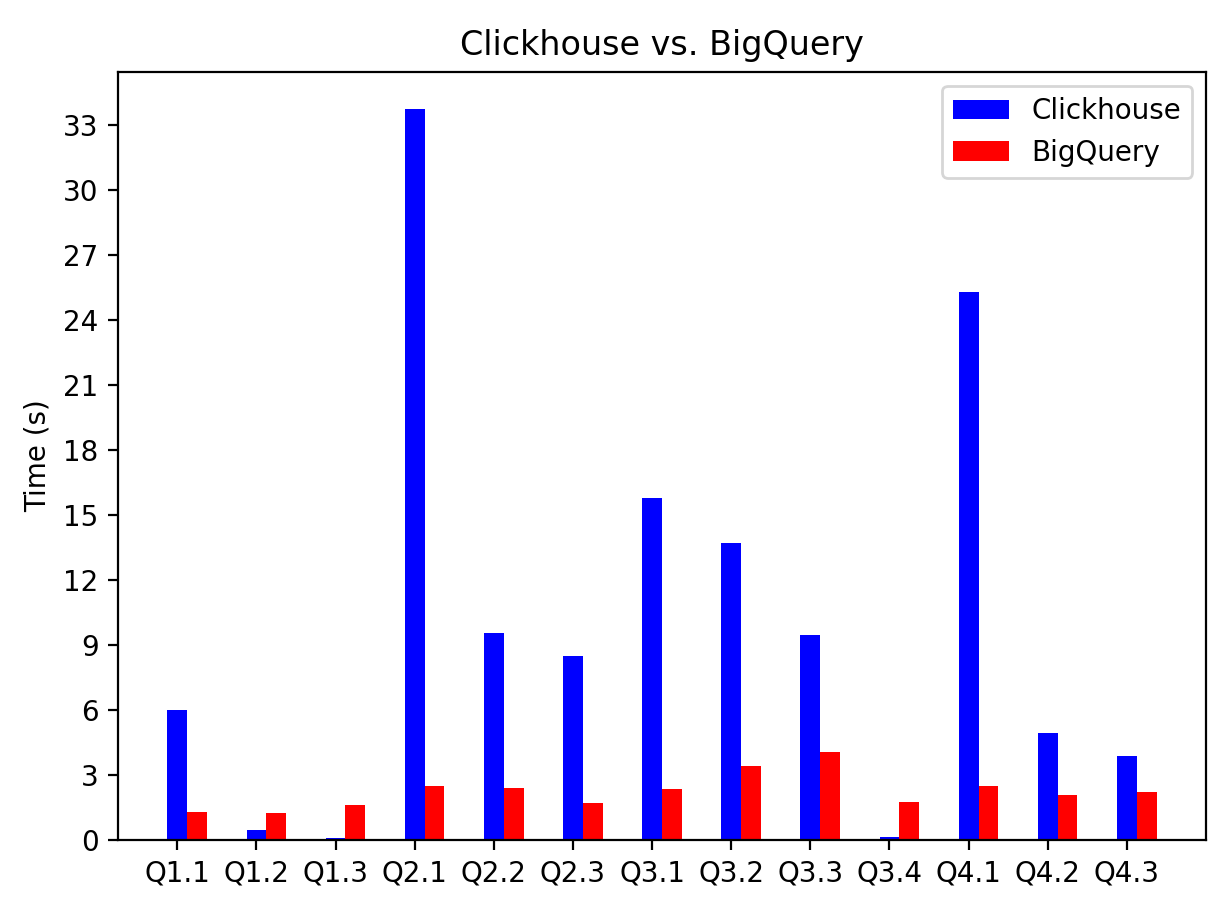
We can easily see BigQuery is faster. I suspect this is because Clickhouse was run on a single node (8 vCPUs and 32 GB RAM). E.g., when the job details of Q2.1 were inspected,

SELECT
    sum(LO_REVENUE) as revenue,
    extract(Year from LO_ORDERDATE) AS year,
    P_BRAND
FROM lineorder_flat
WHERE P_CATEGORY = "MFGR#12" AND S_REGION = "AMERICA"
GROUP BY
    year,
    P_BRAND
ORDER BY
    year,
    P_BRAND

BiqQuery shows 3 stages:

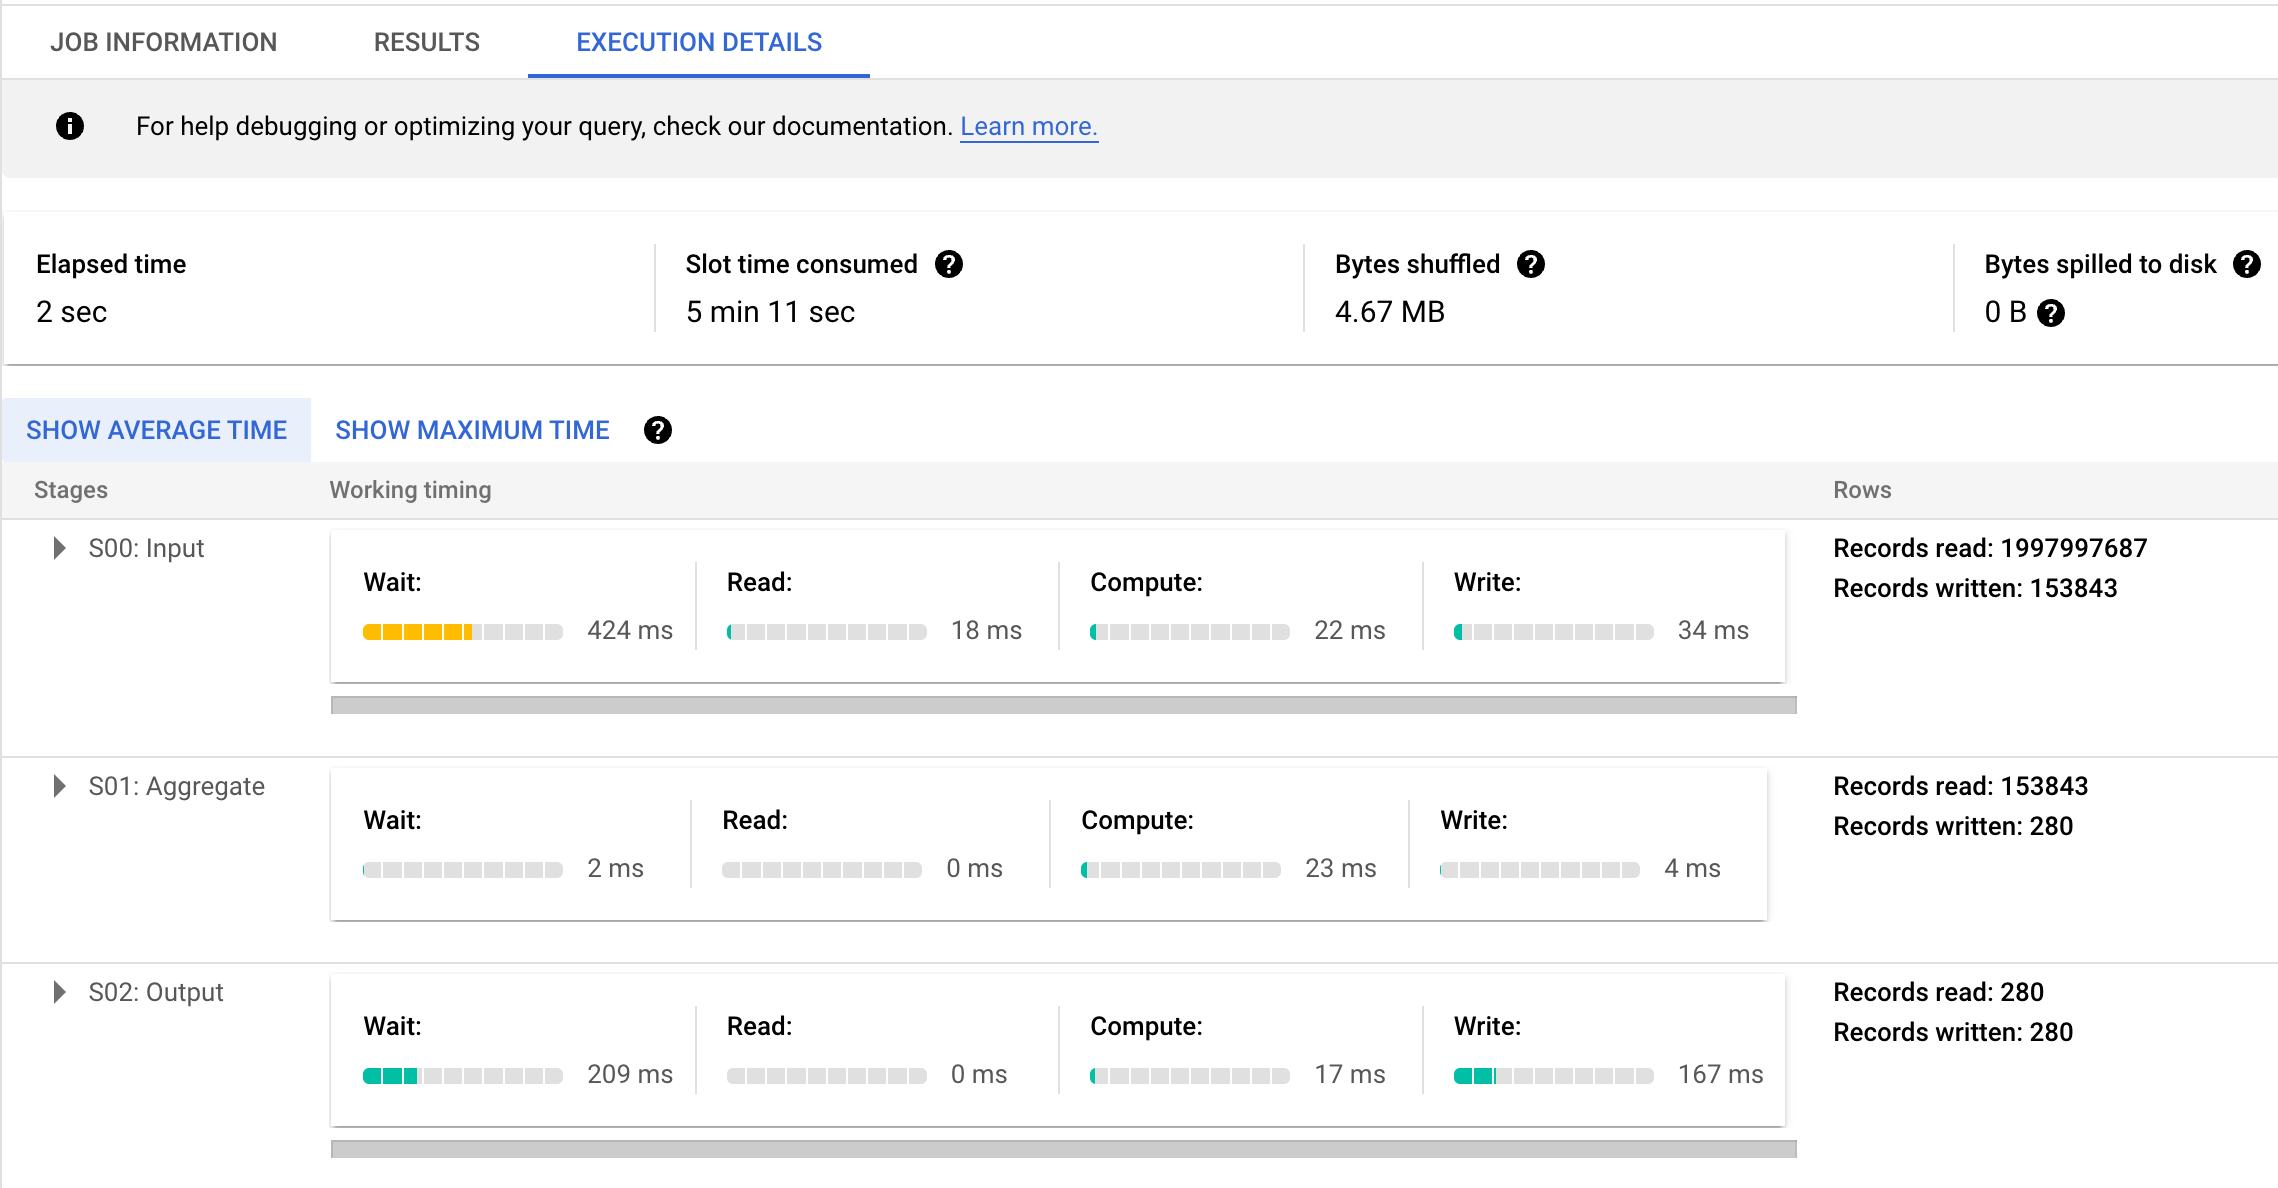
and drilling further, it was seen there were 3847 parallel inputs in Stage 1 (S00). Both BigQuery and Clickhouse did a full table scan but BigQuery massively parallelized the work across 3847 workers (slots). Its hard to beat this. The total slot milliseconds of BigQuery came in at 311,716 ms.

It is also interesting to compare the execution details of Q1.3 where Clickhouse beats BigQuery (0.108ms for Clickhouse vs 1.6s for BQ). The query itself is:

SELECT sum(LO_EXTENDEDPRICE * LO_DISCOUNT) AS revenue
FROM lineorder_flat
WHERE (toISOWeek(LO_ORDERDATE) = 6) AND (toYear(LO_ORDERDATE) = 1994) AND ((LO_DISCOUNT >= 5) AND (LO_DISCOUNT <= 7)) AND ((LO_QUANTITY >= 26) AND (LO_QUANTITY <= 35))

Clickhouse was blazingly fast on this query and was seen to process 5.89 million rows whereas BigQuery for some reason processed 303,097,581 rows (which was also equal to the total number of rows in the partition containing the year 1994 and 50 times more than 5.89M; recall there are 52 weeks in a year) across 587 workers.

It is instructive to compare the # of rows processed between the two. This is shown by following graph:

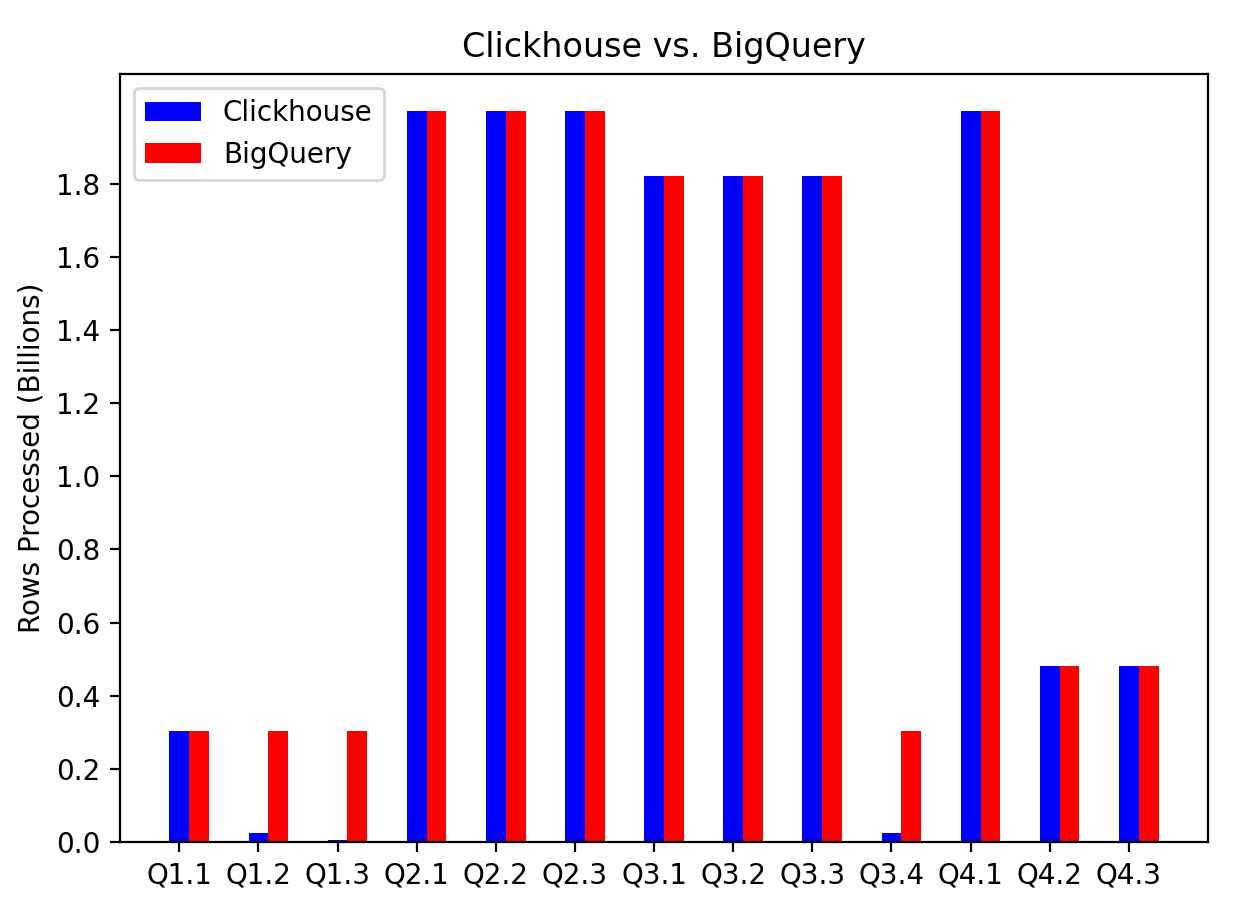
It can be seen that the cases when Clickhouse is faster (Q1.2, Q1.3 and Q 3.4) can be attributed to scanning through a much smaller subset of the data. In all these cases the query had a where filter which was more fine-grained than just the year. E.g., in Q1.2 has predicate on month, Q1.3 has predicate on ISO week and Q3.4 has predicate on month again.

Conclusion

This brings us to the conclusion. Although we can see that BigQuery is faster, this post is not meant to endorse BigQuery over Clickhouse. Clickhouse was run on a single node – who knows what the numbers would be if its run on a cluster? But the question is how do you decide how big of a cluster to provision? And once you have provisioned the cluster, its static – you can’t resize it – or maybe you can but it won’t be trivial and not something you would do often. This is where BigQuery really shines and is the most important lesson learned. It dynamically auto-scales the compute in response to the query. It might not do as clever of indexing (refer [2] and [3]) but its hard to beat the massive parallelization it does behind the scenes. It can pretty much brute-force any query and still come on top. The motivation to use CH would be when you want to reduce costs and do things in-house.

Appendix: DuckDB Notes

In case of DuckDB tests were run on same machine as CH e2-standard-8 with 8 vCPU and 32GB RAM. I found that DuckDB did not take advantage of multiple CPUs while running the queries. The CPU usage was between 100-200% with more towards the lower end. Also below are sizes to give an idea:

ObjectSize (GB)
lineorder.lbl239
DuckDB table after loading lineorder.tbl but before denormalization (joins with other tables)60
DuckDB table after lineorder has been denormalized to lineorder_flat259

In addition denormalization step took 3073s. Other thing to add as a note is that DuckDB uses single quotes instead of double quotes in WHERE clause. So WHERE P_CATEGORY = "MFGR#12" AND S_REGION = "AMERICA" becomes WHERE P_CATEGORY = 'MFGR#12' AND S_REGION = 'AMERICA'.

Posted in Computers, programming, Software | Tagged , | Leave a comment

Java vs. Node.js: Performance comparison of blocking vs. non-blocking I/O

There are many online articles touting the advantages of non-blocking I/O over blocking I/O. But I wanted to see the difference for myself. So to do that, I developed an application two ways: one using Spring WebMVC + JPA which uses blocking I/O and another using Node.js which uses non-blocking I/O. MySQL database was used in both cases. In case of Node.js I used the Sequelize ORM. Spring JPA uses Hibernate ORM. I wanted the application to be complex enough to mimic a real-world scenario so the test results could be meaningful. Thus our application makes use of transactions, locking and SELECT, INSERT as well as UPDATE statements. In fact, I also made use of protocol buffers and there is some message decoding that happens in the application before it can process a message.

Problem Description

We consider a fictitious company selling some sort of products and what we want to do is to compute half-yearly sales of each product. E.g., imagine Toyota selling cars and it wants to calculate how many Toyota Corollas were sold in H1 2022 (H1 stands for first-half of the year) or Microsoft selling Office Subscription. For this we create 2 tables – one stores each booking or sale and another stores the aggregate sales divided over the different fiscal periods. The details of the tables are given below but not important. What is important is that we execute INSERT statements on the bookings table for each new sale. And need to INSERT or UPDATE values in the aggregates table. Further the operations need to be wrapped in a transaction and we also have to lock rows in the aggregates table using SELECT FOR UPDATE before updating them. So you can see we are not developing a trivial or toy application.

Bookings Table

+--------------+---------------+------+-----+-------------------+-------------------+
| Field        | Type          | Null | Key | Default           | Extra             |
+--------------+---------------+------+-----+-------------------+-------------------+
| row_id       | int           | NO   | PRI | NULL              | auto_increment    |
| booking_id   | varchar(255)  | NO   |     | NULL              |                   |
| created_at   | timestamp     | NO   |     | CURRENT_TIMESTAMP | DEFAULT_GENERATED |
| dollar_value | decimal(19,2) | NO   |     | NULL              |                   |
| end_date     | date          | NO   |     | NULL              |                   |
| origin_ts    | timestamp     | NO   |     | NULL              |                   |
| parent_id    | varchar(255)  | YES  |     | NULL              |                   |
| trim          | varchar(255)  | NO   |     | NULL              |                   |
| model          | varchar(255)  | NO   |     | NULL              |                   |
| stage        | varchar(255)  | YES  |     | NULL              |                   |
| start_date   | date          | NO   |     | NULL              |                   |
| type         | varchar(255)  | YES  |     | NULL              |                   |
+--------------+---------------+------+-----+-------------------+-------------------+
12 rows in set (0.00 sec)

Aggregates Table

+---------------------+---------------+------+-----+-------------------+-------------------+
| Field               | Type          | Null | Key | Default           | Extra             |
+---------------------+---------------+------+-----+-------------------+-------------------+
| row_id              | int           | NO   | PRI | NULL              | auto_increment    |
| version             | int           | NO   |     | NULL              |                   |
| last_updated        | timestamp     | NO   |     | CURRENT_TIMESTAMP | DEFAULT_GENERATED |
| model                 | varchar(255)  | NO   |     | NULL              |                   |
| trim                 | varchar(255)  | NO   | MUL | NULL              |                   |
| total_dollar_amount | decimal(19,2) | NO   |     | NULL              |                   |
| fiscal_period_id   | int           | NO   | MUL | NULL              |                   |
+---------------------+---------------+------+-----+-------------------+-------------------+
7 rows in set (0.00 sec)

I actually make use of a 3rd table to store data about the fiscal period and the fiscal_period_id is a FK to a row in that table. So we see the data model – while not rich enough – is hopefully complex enough for a perf test to be meaningful and mimic real-world scenario.

Deployment and Test Setup

Both the Java and Node.js app were deployed on GCP using Cloud Run. Both apps ran on a VM with 4 CPU cores and 4GB RAM (--cpu=4 and --memory=4Gi). In case of Java app I set the # of app instances to 1 whereas in case of Node.js we use 4 app instances to cover all the 4 CPUs available. Java app would use threads to max out the CPU resources available.

For testing I used JMeter and configured it to mimic 500 concurrent users (500 threads) making requests as fast as they can. In all total 50,000 requests were made (100 requests per user).

And what do we get?

Java Spring WebMVC + JPA (Blocking I/O)

The results were quite impressive. The application was able to handle the load of 500 concurrent threads and not a single request failed. It blew away my expectations. Overall I got:

582 requests per second with 831ms median response time

Node.js with Express, MySQL2 and Sequelize

842 requests per second with 432ms median response time

There are 29 requests that failed out of 50,000 due to request timeout.

What do I make of it?

Node.js performed better but the difference is not what I would call as staggering.

Node.js gives a 40% higher throughput than Java and confirms the rule of thumb – for I/O bound applications Node.js will perform better with its non-locking I/O whereas for CPU bound applications Java will perform better. The result is also inline with another study described here (this post motivated me to do my own test) where it was found that Spring WebFlux + R2DBC gave 30% higher throughput than Spring Web MVC + JDBC at high concurrency. That test was conducted using PostgreSQL database by the way – the database used and its driver can make a huge difference in the results. I feel the 40% increase we observed is significant enough for a mission critical application. It might not be overwhelming enough to warrant re-writing an existing application, but significant enough to tilt the balance in favor of Node.js when developing a greenfield application. Of course, there may be other things you want to consider such as library and data-structures support (Node.js comes with only two data structures – arrays and dictionaries) while performing a full evaluation.

What about non-blocking I/O in Java?

IMO Java is currently trying to add support for asynchronous and non-blocking calls to MySQL. The effort is part of a bigger movement towards reactive programming. From spring.io/reactive:

Reactive systems have certain characteristics that make them ideal for low-latency, high-throughput workloads. Project Reactor and the Spring portfolio work together to enable developers to build enterprise-grade reactive systems that are responsive, resilient, elastic, and message-driven.

There are two libraries in Java for making async calls to MySQL: jasync-r2dbc-mysql and r2dbc-mysql. A third option is vertx-mysql-client but its not based on R2DBC and does not integrate with Spring. I tried using all three but ran into issues. The r2dbc-mysql project is not being actively worked on in fact and hasn’t even matured to a 1.0 release. The other library is also not used extensively in production (at least that’s what it seems like to me) and developed by an independent developer without the backing of a large enterprise company. New code seems to be released without any testing. There were cases where a bug was reported, the developer quickly made a release with the bugfix but introduced another bug in the process. In fact, the r2dbc-spi (the Service Provider Interface that defines the API that drivers have to implement) itself is very recent and only achieved the 1.0.0 milestone on Apr 25 this year (2022). And this is not the end. The Java community is currently working on Project Loom which will bring coroutines (lightweight user-mode threads managed by JVM, not the OS) to Java (analogous to goroutines in Go) and eliminate the distinction between synchronous (JDBC) and asynchronous code (R2DBC). So the R2DBC technology of today will be supplanted by another API eventually and the programming model might change again. R2DBC might not become JDBCs successor after all. With vertx-mysql-client I ran into this issue.

To me, what this means is that for asynchronous and non-blocking I/O we are better off with a technology like Node.js.

For further reading, refer this related article which has a very similar setup except that it uses non-blocking I/O on Java side and further uses MongoDB. It reports identical performance between Java and Node.js when both are using non-blocking I/O with MongoDB.

Also see This website for spring-jpa vs. node.js:

Their database is PostgreSQL in case of spring-jpa and MySQL in case of Node.js. It contains many more benchmarks.

Posted in Computers, programming, Software | Tagged , , , , | Leave a comment

How the choice of words changes the meaning of a sentence

Sometime ago – I don’t have the exact post – I read something like this on my LinkedIn feed:

Recruit people who are aligned with your vision, values, ideas and principles

And sure enough it got a lot of likes. Now imagine if the person had instead said:

Recruit sychophants

How many likes do you think the post would have gotten?

Take another example. As I read Dale Carnegie’s famous book, in one of his chapters he says:

Let the other person feel that the idea is his or hers

In other words, plant the idea in their mind (inception). How about this:

Let the other person steal your ideas

Posted in General | Leave a comment

Why I Hate Meetings esp. Zoom

  • Meetings are a test of how vocal someone is. People who are most vocal, not necessarily most knowledgeable, control and ruin the meetings. In other words, meetings don’t give everyone the equal chance to speak.
  • Constant interruptions esp. on Zoom. You don’t get to finish.
  • No time to think. Again, people who can ramble keep on talking.
  • Corporate governance gives a lot of attention to D&I these days. However, how many leaders make sure everyone is given a chance to speak in meetings? Some people are naturally shy to speak yet have good ideas and feedback. Others for which English is not the first language, face a language barrier.
  • The usefulness of a meeting is inversely proportional to the number of attendees.
  • Hard to understand people over Zoom (voice quality compounded with accents)
  • Once you are in the meeting, its hard to leave even though you feel the meeting is wasting your time.
  • The list is endless…

The only way to have deep thoughtful and esp. technical conversations is through the written medium. This principle is so obvious, yet so uncommon. The organization that follows this is already half-way ahead of its competition.

Posted in General | Leave a comment

Step by step guide to profiling Java applications with VisualVM

VisualVM is a great tool to profile your Java applications. Here I describe the steps I followed to get it working. The steps are wrt Visual VM 2.1.4. I installed VisualVM by downloading the dmg file from their website. Then using it was easy. Just open the application and it will show all the Java processes running on your system. The part where it got challenging was getting it to work with remote applications.

I had a remote application running on a Linux VM in GCP (Google Cloud Platform).

Linux instance-1 5.10.0-15-cloud-amd64 #1 SMP Debian 5.10.120-1 (2022-06-09) x86_64
$ java --version
openjdk 17.0.4 2022-07-19
OpenJDK Runtime Environment (build 17.0.4+8-Debian-1deb11u1)
OpenJDK 64-Bit Server VM (build 17.0.4+8-Debian-1deb11u1, mixed mode, sharing)

Step 1: Run jstatd on the remote VM

On your remote VM, open ~/.bash_profile and edit it so:

function run_jstatd() {
# https://stackoverflow.com/a/15176142/147530
        policy=${HOME}/.jstatd.all.policy
[ -r ${policy} ] || cat >${policy} <<'POLICY'
grant codebase "jrt:/jdk.jstatd" {
permission java.security.AllPermission;
};
grant codebase "jrt:/jdk.internal.jvmstat" {
   permission java.security.AllPermission;
};
POLICY
#https://stackoverflow.com/a/33219226/147530
jstatd -J-Djava.security.policy=${policy} -J-Djava.rmi.server.hostname=x.x.x.x -J-Djava.net.preferIPv4Stack=true -J-Djava.rmi.server.logCalls=true &
}

Save it and reload it by running:

$ exec -l $SHELL

Then run:

$ run_jstatd

Verify jstatd is correctly running:

$ ss -tpln
State      Recv-Q     Send-Q         Local Address:Port          Peer Address:Port     Process
LISTEN     0          80                 127.0.0.1:3306               0.0.0.0:*
LISTEN     0          50                   0.0.0.0:41013              0.0.0.0:*         users:(("jstatd",pid=768055,fd=9))
LISTEN     0          128                  0.0.0.0:22                 0.0.0.0:*
LISTEN     0          50                         *:43331                    *:*         users:(("java",pid=768189,fd=14))
LISTEN     0          50                         *:1099                     *:*         users:(("jstatd",pid=761237,fd=11))
LISTEN     0          50                         *:36175                    *:*         users:(("jstatd",pid=767916,fd=9))
LISTEN     0          50                         *:37199                    *:*         users:(("jstatd",pid=761237,fd=9))

You may see less or more output but usually port 1099 will be in the list as that seems to be the default port it uses.

Now as per docs you can connect VisualVM to the remote VM. However it didn’t work for me and kept me occupied for a long time. The trick was the next step…

Open up firewall to port 1099

Check on your client machine that you are able to connect to port 1099:

$ nc -zv x.x.x.x 1099

This will give a timeout if port 1099 is blocked by a firewall as was in my case. To open this port in GCP there are two things you need to do. Below is assuming your VM is in a VPC network. The steps will need to be modified if VM is not in a VPC Network:

  1. First, edit your VM and associate a network tag to it. I used the tag visualvm-monitoring. You can name the tag anything you want. You will need it in the next step.
  2. Then, goto VPC Network and create a rule. Here you will use the tag in step 1

The command line to do it looks as follows:

$ gcloud compute --project=xxx firewall-rules create allow-1099 --description="Allow port 1099 for VisualVM" --direction=INGRESS --priority=1000 --network=default --action=ALLOW --rules=all --source-ranges=0.0.0.0/0 --target-tags=visualvm-monitoring

Once you have opened up the port nc should be able to connect to it. This really was the biggest stumbling piece for me.

Add remote host to Visual VM

Steps to do this are documented. To add a remote host, right-click the Remote node in the Applications window, choose Add Remote Host and type the host name or IP address in the Add Remote Host dialog box. (You can also specify a display name that will be used to refer to the host when listed under the Remote node.)

And Viola! It works!

On the remote machine, I did see a constant stream of

FINER: RMI TCP Connection(16)-x.x.x.x: [x.x.x.x: sun.tools.jstatd.RemoteVmImpl[4ba38792:183474326e5:-7ff6, -3395430355800016994]: public abstract byte[] sun.jvmstat.monitor.remote.RemoteVm.getBytes() throws java.rmi.RemoteException]
Sep 16, 2022 6:13:33 PM sun.rmi.server.UnicastServerRef dispatch
FINER: RMI TCP Connection(16)-x.x.x.x: [x.x.x.x: sun.tools.jstatd.RemoteHostImpl[4ba38792:183474326e5:-7fff, -6901610018974223180]: public abstract int[] sun.jvmstat.monitor.remote.RemoteHost.activeVms() throws java.rmi.RemoteException,sun.jvmstat.monitor.MonitorException]

The only missing piece (and unfortunately the reason I wanted to use VisualVM) is the Threads view that I was not able to get working. I was esp. interested in it because I wanted to see how many threads are blocked when I make calls to MySQL in my Spring app. I tried running my program with

as suggested but the Threads still didn’t show up. The threads view did show for the local applications. Maybe I’ll fix it in time. Until then…

Troubleshooting

You can find VisualVM logs by going to Visual VM -> About Visual VM -> Logfile on the Mac. It can take a while to load. The logfile location on my Mac is $HOME/Library/Application Support/VisualVM/2.1.4/var/log/messages.log.

Posted in Computers, programming, Software | Tagged , , | Leave a comment

Explaining VPC Service Controls to a 3 yr old

Imagine someone steals your Social Security number, Date of Birth and other identifying information. They then call your bank to transfer money into their account but the bank tells them it does not recognize the phone number from which they are calling and refuses the transfer. Well, that’s exactly what VPC service controls are. They allow you to secure your GCP resources in addition to Identity based Access Management.

Let’s go a step further and imagine for a second the thief also steals your mobile phone. When they call your bank asking to transfer money, the bank tells them you have prohibited transfers outside your bank. VPC service controls provide this as well in the form of egress policies.

Posted in Computers, programming, Software | Tagged | Leave a comment

Java Programming Tips

Learn JShell

Java 9 ships with jshell which provides an interpretive shell-like environment (a REPL) for Java. This is extremely useful for prototyping, testing and learning how to use a new library. Here I describe how to use it in context of your Maven project. Simply run:

$ mvn com.github.johnpoth:jshell-maven-plugin:1.3:run

from the root directory of your Maven project. It will launch a new shell and import all the dependencies declared in your pom.xml! From here on you can start hacking away. Below I describe how I used jshell to test connection to MySQL db:

jshell> import java.sql.*;

jshell> String url="jdbc:mysql://x.y.z.w/my_db";
url ==> "jdbc:mysql://x.y.x.w/my_db"

jshell> var conn = DriverManager.getConnection(url, username, password);
conn ==> com.mysql.cj.jdbc.ConnectionImpl@279fedbd

jshell> conn.isValid(10);
$4 ==> true

jshell> /exit
|  Goodbye

Tips on using Reflection in Java

Problem: java.lang.NoSuchMethodException when calling getConstructor

Solution: check the class is marked as public

Problem: java.lang.SecurityException: Invalid signature file digest for Manifest main attributes when running a fat jar built using Maven shade plugin

Solution: Add following to pom.xml under the Shade plugin

<configuration>
            <filters>
            <!-- this filter will avoid Error: A JNI error has occurred, please check your installation and try again
Exception in thread "main" java.lang.SecurityException: Invalid signature file digest for Manifest main attributes. see
        https://stackoverflow.com/a/6743609/147530 -->
        <filter>
            <artifact>*:*</artifact>
            <excludes>
                <exclude>META-INF/*.SF</exclude>
                <exclude>META-INF/*.DSA</exclude>
                <exclude>META-INF/*.RSA</exclude>
            </excludes>
        </filter>
    </filters>
...
</configuration>

Debugging Java programs from the command-line with jdb – Java command-line debugger

You use jdb for this. There is surprisingly little information available on this (esp. the commands). Start with official documentation [1]. Refer this for more.

Here are some of the most commonly used JDB commands

  • run – Starts the execution of the program.
  • stop at <class>:<line> – Sets a breakpoint at the specified line in the specified class.
  • stop at <class>.<method> – Sets a breakpoint at the beginning of the specified method in the specified class.
  • step – Executes the current line of code and stops at the next line. If the current line contains a method call, JDB steps into the method and stops at the first line of the method.
  • stepi – step into
  • next – Executes the current line of code and stops at the next line. If the current line contains a method call, JDB executes the method call and stops at the next line after the method call.
  • cont – Continues the execution of the program until the next breakpoint or until the program completes.
  • list – Lists the source code around the current execution point.
  • print <expression> – Prints the value of the specified expression.
  • locals – Lists the local variables in the current frame.
  • classes – Lists all loaded classes.
  • methods <class> – Lists all methods in the specified class.
  • thread – Lists all threads and their current status.
  • suspend – Suspends all threads.
  • resume – Resumes some or all the threads. otherwise its similar to cont.
  • help – Displays a list of available JDB commands.
  • exit – Exits JDB.
  • clear – delete breakpoint. clear class:line or clear class.method
  • up/down – move up and down the call stack.
  • where – prints the callstack
  • dump – similar to print
> help
** command list **
connectors                -- list available connectors and transports in this VM

run [class [args]]        -- start execution of application's main class

threads [threadgroup]     -- list threads in threadgroup. Use current threadgroup if none specified.
thread <thread id>        -- set default thread
suspend [thread id(s)]    -- suspend threads (default: all)
resume [thread id(s)]     -- resume threads (default: all)
where [<thread id> | all] -- dump a thread's stack
wherei [<thread id> | all]-- dump a thread's stack, with pc info
up [n frames]             -- move up a thread's stack
down [n frames]           -- move down a thread's stack
kill <thread id> <expr>   -- kill a thread with the given exception object
interrupt <thread id>     -- interrupt a thread

print <expr>              -- print value of expression
dump <expr>               -- print all object information
eval <expr>               -- evaluate expression (same as print)
set <lvalue> = <expr>     -- assign new value to field/variable/array element
locals                    -- print all local variables in current stack frame

classes                   -- list currently known classes
class <class id>          -- show details of named class
methods <class id>        -- list a class's methods
fields <class id>         -- list a class's fields

threadgroups              -- list threadgroups
threadgroup <name>        -- set current threadgroup to <name>
threadgroup               -- set current threadgroup back to the top level threadgroup

stop [go|thread] [<thread_id>] <at|in> <location>
                          -- set a breakpoint
                          -- if no options are given, the current list of breakpoints is printed
                          -- if "go" is specified, immediately resume after stopping
                          -- if "thread" is specified, only suspend the thread we stop in
                          -- if neither "go" nor "thread" are specified, suspend all threads
                          -- if an integer <thread_id> is specified, only stop in the specified thread
                          -- "at" and "in" have the same meaning
                          -- <location> can either be a line number or a method:
                          --   <class_id>:<line_number>
                          --   <class_id>.<method>[(argument_type,...)]
clear <class id>.<method>[(argument_type,...)]
                          -- clear a breakpoint in a method
clear <class id>:<line>   -- clear a breakpoint at a line
clear                     -- list breakpoints
catch [uncaught|caught|all] <class id>|<class pattern>
                          -- break when specified exception occurs
ignore [uncaught|caught|all] <class id>|<class pattern>
                          -- cancel 'catch' for the specified exception
watch [access|all] <class id>.<field name>
                          -- watch access/modifications to a field
unwatch [access|all] <class id>.<field name>
                          -- discontinue watching access/modifications to a field
trace [go] methods [thread]
                          -- trace method entries and exits.
                          -- All threads are suspended unless 'go' is specified
trace [go] method exit | exits [thread]
                          -- trace the current method's exit, or all methods' exits
                          -- All threads are suspended unless 'go' is specified
untrace [methods]         -- stop tracing method entries and/or exits
step                      -- execute current line
step up                   -- execute until the current method returns to its caller
stepi                     -- execute current instruction
next                      -- step one line (step OVER calls)
cont                      -- continue execution from breakpoint

list [line number|method] -- print source code
use (or sourcepath) [source file path]
                          -- display or change the source path
exclude [<class pattern>, ... | "none"]
                          -- do not report step or method events for specified classes
classpath                 -- print classpath info from target VM

monitor <command>         -- execute command each time the program stops
monitor                   -- list monitors
unmonitor <monitor#>      -- delete a monitor
read <filename>           -- read and execute a command file

lock <expr>               -- print lock info for an object
threadlocks [thread id]   -- print lock info for a thread

pop                       -- pop the stack through and including the current frame
reenter                   -- same as pop, but current frame is reentered
redefine <class id> <class file name>
                          -- redefine the code for a class

disablegc <expr>          -- prevent garbage collection of an object
enablegc <expr>           -- permit garbage collection of an object

!!                        -- repeat last command
<n> <command>             -- repeat command n times
repeat                    -- show whether GDB-style empty command repetition is enabled
repeat <on|off>           -- enable/disable GDB-style repetition
# <command>               -- discard (no-op)
help (or ?)               -- list commands
dbgtrace [flag]           -- same as dbgtrace command line option
version                   -- print version information
exit (or quit)            -- exit debugger

Here is how to do things with jdb in Q&A format:

How do I run jdb without needing to attach to a process?

jdb -classpath $CLASSPATH -sourcepath $SOURCE_PATH $MAIN_CLASS $ARGS

This will start jdb and immediately pause waiting for you to give the run command to continue execution. You should set some breakpoints before you run run otherwise the program will just execute without ever breaking.

How to attach to a running process?

The other option is to be able to attach to a running java program. In order to do this the java program must be run with following options which will enable jdb to attach to the process:

java -agentlib:jdwp=transport=dt_socket,server=y,suspend=y,address=*:5005 ...

If you get some cryptic zsh error try escaping the * using a backslash \ like this:

java -agentlib:jdwp=transport=dt_socket,server=y,suspend=y,address=\*:5005 ...

How do I provide the classpath to jdb?

The -cp option for specifying classpath does not work with jdb. You have to use -classpath. Another reason why I hate Java [1].

How do I print the callstack?

use where

How do I set breakpoint?

stop at com.mycompany.app.MyClass:65

How do I step into a method?

I could not find a way to differentiate between step into, step over or step out. The step command advances execution to the next line whether it’s in the current stack frame or a called method. The next command advances execution to the next line in the current stack frame.

How to print a variable?

locals will print local variables. use print to print a variable

Can I list all the loaded classes?

Yes, using classes

Decompiling Java Code

You can use decompiler.com if you don’t want to install anything. Otherwise install jd-gui or the fernflower decompiler. For jd-gui:

wget https://github.com/java-decompiler/jd-gui/releases/download/v1.6.6/jd-gui-1.6.6.jar

Then run it like:

java -jar jd-gui-1.6.6.jar

It will open a easy to use GUI.

It works pretty well but if you want to decompile a whole bunch of code and generate .java files to open in VS Code etc. try fernflower:

wget https://www.jetbrains.com/intellij-repository/releases/com/jetbrains/intellij/java/java-decompiler-engine/241.14494.240/java-decompiler-engine-241.14494.240.jar

Example usage:

java -jar java-decompiler-engine-241.14494.240.jar -hes=0 -hdc=0 $SOURCE_DIR $DEST_DIR

fernflower is also more up to date. With jd-gui I got this error when trying to decompile a file:

java.lang.IllegalArgumentException: Unsupported class file major version 61

fernflower was able to handle it. For small files you can use the java decompiler that comes with JDK:

javap -c -l Program.class

Understanding JDB Internals – How does the Java Debugger work?

The best way to understand the internals of anything is to study its source code. Luckily, jdb‘s source code is available publicly though finding it is somewhat of a treasure hunt and you can’t view it in Chrome like you can do with a github repo. But look no further. Download jdk-8-macosx-x64-demos.zip file from Misc. Java SE Tools and Libraries Downloads page. Extract the zip file. Then extract examples.jar under demo/jpda (or you can extract src.zip). jdb documentation is available under demo/jpda/com/sun/tools/example/doc/jdb.html. From there we see the Java file corresponding to the jdb program is demo/jpda/com/sun/tools/example/debug/tty/TTY.java. You can even modify the source code and add additional features e.g., one problem I have faced using jdb is inspecting the contents of a large array. In my case I wanted to print the URLs of an array containing 197 java.net.URL. There is no easy way to do this in jdb.

Running (and debugging) JUnit tests from the command-line

Why? because 9 out of 10 times the test runner in VS Code cannot recognize the tests [1] and I eventually gave up trying to wrestle with it. So free yourself from being dependent on it.

JUnit4:

java \
-cp $CLASSPATH \
--add-opens java.base/sun.nio.ch=ALL-UNNAMED \
--add-opens java.base/java.nio=ALL-UNNAMED \
--add-opens java.base/java.util.concurrent=ALL-UNNAMED \
--add-opens java.base/java.util.concurrent.atomic=ALL-UNNAMED \
--add-opens java.base/java.util.concurrent.locks=ALL-UNNAMED \
--add-opens java.base/java.util=ALL-UNNAMED \
org.junit.runner.JUnitCore \
com.mycompany.app.BdbTest

make sure you include target/test-classes in the CLASSPATH

JUnit5:

  1. Download the junit-console-standalone jar
  2. Compile your code: mvn compile and mvn test-compile
  3. Get the classpath: mvn dependency:build-classpath
  4. Run your tests from command-line like below (the add-opens and add-modules are just shown for illustration):
# get the runner from https://repo1.maven.org/maven2/org/junit/platform/junit-platform-console-standalone/1.9.3/
JUNIT_RUNNER=/Users/xxx/bin/junit-platform-console-standalone-1.9.3.jar

# make sure you ran mvn test-compile. replace class and method name as appropriate.
# to debug simply add -agentlib:jdwp=transport=dt_socket,server=y,suspend=y,address=\*:5005 to the java command
# the -c and -m flags act like a UNION. both are applied as filters and their results are UNIONed.
# the method name must start with a fully qualified class name followed by a '#' and then the method name, optionally followed by a parameter list enclosed in parentheses
java \
--enable-preview --add-modules jdk.incubator.vector -ea \
--add-opens java.base/java.lang=ALL-UNNAMED \
--add-opens java.base/java.lang.invoke=ALL-UNNAMED \
-cp $JUNIT_RUNNER:target/test-classes:target/classes:$CLASSPATH \
org.junit.platform.console.ConsoleLauncher \
-c com.example.Tests \
-m com.example.Tests#test1

Now you are not at mercy of VS code and can also debug easily if you want.

example To execute tests using maven surefire plugin:

mvn -Dtest=com.web.DatabaseTests#test1 -DargLine="-DJWT_SECRET_KEY=hahaha! -Djava.library.path=lib" test

Above will run the test1 inside class com.web.DatabaseTests. It also shows how to set system properties (JVM arguments) using -DargLine

JUnit5 Tips

Note that by default JUnit 5 creates a new instance of the test class for every test method. In a way this is good as it avoids any unintended side-effects. No test can interfere with another test. This default behavior can be overriden if desired by using the @TestInstance(Lifecycle.PER_CLASS) annotation.

See contents of jar file without unzipping (extracting) it

unzip -l HTTPClient-0.3-3.jar

Concurrency Tips – When should you make a class thread safe?

There are so many tips here that it is a book unto itself but one is worth covering which is addressing the question When should you make a class thread safe? First, we need to be clear on what we mean by thread safe. It does not need a big blog post. Thread safety simply means this

(Definition): if a class is thread safe then multiple threads can call methods on instance of the class simultaneously (concurrently) and the result will be the same as if the methods had been called one after another by a single thread.

Note that we cleverly left out clarifying the issue that if methods are called one after another then implicit in this statement is a hidden order of invocation. What is the order? The order is undefined and that is what race-condition alludes to. The class only guarantees the result will be as if the methods had been called one after another (in some order) but the exact order is indeterministic and not defined or part of the contract.

Now we address the question when should a class be made thread safe? First, realize it is trivial to make any class thread safe by just adding the synchronized keyword to all the methods of the class. The effect is the same as if the client had locked on the instance before invoking the method. i.e,

public synchronized void foo();

is exactly equal to:

synchronized(obj) {
   obj.foo();
}

Given this, should you ever make a class thread safe using the trivial approach? Why not let the caller do it? Its something the caller can do easily if they want to. That way the class is more general – a caller that will not be calling the class from multiple threads will not have to pay the penalty of synchronization (obtaining a lock).

Finally we come to the guideline from Effective Java (quoting from the book p. 322) which I think is on point:

If you are writing a mutable class, you have two options: you can omit all synchronization and allow the client to synchronize externally if concurrent use is desired, or you can synchronize internally, making the class thread-safe. You should choose the latter option only if you can achieve significantly higher concurrency with internal synchronization than you could by having the client lock the entire object externally.

Note on jar signing – what it protects and what it doesn’t

Jar signing does not protect you against someone modifying the binary and then signing it with their own signature. All jar signing does is that provide evidence that the jar was signed by so and so person. If there was some mechanism which would only let the jar execute if it was signed by you then only you are protected. Bob can create a new jar and sign it with their credentials. It does not prevent the hacked jar from executing. All it does is show that the jar is not signed by you. So main benefit of jar signing is to protect against a user downloading a malicious binary e.g., if Bob attempts to sell a hacked binary pretending that its original and coming from you then a user can verify the binary is not original and refuse to buy it. But nothing prevents Bob from running the hacked binary on his machine should he chose to do so.

Super Useful Maven Command to get the full classpath

mvn -q -DincludeScope=runtime dependency:build-classpath -Dmdep.outputFile=cp.txt

then use it like

java -cp "target/classes:$(cat cp.txt)" \
     com.mycompany.app.Program \
     arg1 arg2 ...

Further Reading

Posted in Computers, programming, Software | Tagged , | Leave a comment

Running Java in a Jupyter Notebook

Yes it is possible using IJava or Ganymede. In this post I describe all the steps I followed to get it to work on a Macbook using IJava. The post assumes you have python3, pip3 and JDK >= 9 installed.

Installing Jupyter

first, we install Jupyter and JupyterLab by running:

$ pip3 install jupyter
$ pip3 install jupyterlab

see this and this for logs.

Install IJava

I installed the precompiled binary using following steps. First, download zip file containing precompiled binary and unzip it. Verify you get a install.py file:

» wget https://github.com/SpencerPark/IJava/releases/download/v1.3.0/ijava-1.3.0.zip
» mkdir IJava
» cd IJava
» tar -xvf ~/Downloads/ijava-1.3.0.zip
» ls
install.py java

Install IJava kernel:

» python3 install.py --sys-prefix
install.py:169: DeprecationWarning: replace is ignored. Installing a kernelspec always replaces an existing installation
  replace=args.replace
Installed java kernel into "/Library/Frameworks/Python.framework/Versions/3.7/share/jupyter/kernels/java"

Create helper script to launch Jupyter

I created following helper script (call it jupyter.sh or maybe just jupyter) in $HOME/bin folder to run Jupyter:

#!/bin/bash
python3 /Library/Frameworks/Python.framework/Versions/3.7/lib/python3.7/site-packages/jupyter.py $@

Tip: You can use the pip3 show command to find the location where pip3 installed a python package. E.g.:

~ ❯ pip3 show jupyter
Name: jupyter
Version: 1.0.0
Summary: Jupyter metapackage. Install all the Jupyter components in one go.
Home-page: http://jupyter.org
Author: Jupyter Development Team
Author-email: jupyter@googlegroups.org
License: BSD
Location: /Library/Frameworks/Python.framework/Versions/3.7/lib/python3.7/site-packages
Requires: jupyter-console, qtconsole, notebook, ipykernel, nbconvert, ipywidgets
Required-by:

You are now ready to go but before you do that its a good idea to verify the IJava kernel was correctly installed. We can now do that by running:

% jupyter kernelspec list
Available kernels:
  java       /Library/Frameworks/Python.framework/Versions/3.7/share/jupyter/kernels/java
  python3    /Library/Frameworks/Python.framework/Versions/3.7/share/jupyter/kernels/python3

Ready to Go

Now you are ready to go. Give jupyter.sh executable privileges. After that to run Jupyter in console mode, run:

» ~/bin/jupyter.sh console --kernel=java

This should give:

Aug 10, 2022 3:37:52 PM io.github.spencerpark.jupyter.channels.Loop start
INFO: Loop starting...
Aug 10, 2022 3:37:52 PM io.github.spencerpark.jupyter.channels.Loop start
INFO: Loop started.
Aug 10, 2022 3:37:52 PM io.github.spencerpark.jupyter.channels.Loop start
INFO: Loop starting...
Aug 10, 2022 3:37:52 PM io.github.spencerpark.jupyter.channels.Loop start
INFO: Loop started.
Aug 10, 2022 3:37:52 PM io.github.spencerpark.jupyter.channels.Loop start
INFO: Loop starting...
Aug 10, 2022 3:37:52 PM io.github.spencerpark.jupyter.channels.Loop start
INFO: Loop started.
Jupyter console 6.4.4

Java 11.0.14+8-LTS-263 :: IJava kernel 1.3.0
Protocol v5.3 implementation by jupyter-jvm-basekernel 2.3.0
In [1]:

and to run Jupyter as a web application, run:

$ ~/bin/jupyter.sh lab

In the logs you should see:

[I 2022-08-10 15:39:58.661 ServerApp] jupyterlab | extension was successfully linked.
[I 2022-08-10 15:39:58.671 ServerApp] nbclassic | extension was successfully linked.
[I 2022-08-10 15:39:58.933 ServerApp] notebook_shim | extension was successfully linked.
[I 2022-08-10 15:39:58.966 ServerApp] notebook_shim | extension was successfully loaded.
[I 2022-08-10 15:39:58.968 LabApp] JupyterLab extension loaded from /Library/Frameworks/Python.framework/Versions/3.7/lib/python3.7/site-packages/jupyterlab
[I 2022-08-10 15:39:58.968 LabApp] JupyterLab application directory is /Library/Frameworks/Python.framework/Versions/3.7/share/jupyter/lab
[I 2022-08-10 15:39:58.972 ServerApp] jupyterlab | extension was successfully loaded.
[I 2022-08-10 15:39:58.980 ServerApp] nbclassic | extension was successfully loaded.
[I 2022-08-10 15:39:58.982 ServerApp] Serving notebooks from local directory: /Users/xxx
[I 2022-08-10 15:39:58.982 ServerApp] Jupyter Server 1.18.1 is running at:
[I 2022-08-10 15:39:58.982 ServerApp] http://localhost:8888/lab?token=9d8044565e6262dbae2bb6d41c3329fb0bdb045d5f8f413a
[I 2022-08-10 15:39:58.982 ServerApp]  or http://127.0.0.1:8888/lab?token=9d8044565e6262dbae2bb6d41c3329fb0bdb045d5f8f413a
[I 2022-08-10 15:39:58.982 ServerApp] Use Control-C to stop this server and shut down all kernels (twice to skip confirmation).
[C 2022-08-10 15:39:58.988 ServerApp]

    To access the server, open this file in a browser:
        file:///Users/xxx/Library/Jupyter/runtime/jpserver-45538-open.html
    Or copy and paste one of these URLs:
        http://localhost:8888/lab?token=9d8044565e6262dbae2bb6d41c3329fb0bdb045d5f8f413a
     or http://127.0.0.1:8888/lab?token=9d8044565e6262dbae2bb6d41c3329fb0bdb045d5f8f413a

It should automatically open your web browser and you should see something similar to:

Click on Java under Notebook and enjoy!

Let me know how it goes!

How it works?

Internally IJava relies on the jshell program that comes with JDK>=9 (hence the dependency) to execute the Java code. Make sure you familiarize yourself with jshell and learn to use it as well.

Posted in Computers, programming, Software | Tagged | Leave a comment

How to measure memory in Java?

Unlike C#, Java does not have a built-in sizeof operator that can return the memory (bytes) consumed by an object. You can however do-it-yourself. The steps are a bit involved and hence summarized below. Here is link to SO answer on same topic.

Create new Java Project

First create a new Java project with just a single class in it. We call it ObjectSizeFetcher. The code for ObjectSizeFetcher is below:

import java.lang.instrument.Instrumentation;

public class ObjectSizeFetcher {
    private static Instrumentation instrumentation;

    public static void premain(String args, Instrumentation inst) {
        instrumentation = inst;
    }

    public static long getObjectSize(Object o) {
        return instrumentation.getObjectSize(o);
    }
}

instrumentation.getObjectSize will return the shallow object size of the argument passed to it. Make sure you understand the difference between shallow vs. deep so you are not caught by surprise.

Next in the pom.xml (the post assumes you are using Maven) add following section. Modify the packageName as needed. If ObjectSizeFetcher is defined in some package, you need to prefix the class name with the fully qualified package name in Premain-Class :

<plugin>
          <artifactId>maven-jar-plugin</artifactId>
          <version>3.1.2</version>
          <configuration>
        <archive>
            <manifest>
                <packageName>com.example</packageName>
            </manifest>
            <manifestEntries>
                <Premain-Class>ObjectSizeFetcher</Premain-Class>
            </manifestEntries>
        </archive>
    </configuration>
        </plugin>

Also as in every pom.xml make sure you declare the group:artifactId:version of your assembly. E.g.:

  <groupId>com.example</groupId>
  <artifactId>instrumentation</artifactId>
  <version>1.0-SNAPSHOT</version>

Now build the project using

$ mvn package

for example. This should generate a jar file under the target directory. Next, install this assembly in the local Maven repository. We do this by running:

$ mvn install

Tip: mvn install will also build the assembly if you haven’t built it already. So technically, you can just run mvn install and skip running mvn package.

Its a good idea now to verify that the jar file was indeed installed in Maven repository $HOME/.m2/repository.

Use the instrumentation jar to measure object sizes in your main app

Now we switch to the main application where you want to measure object sizes. First, you have to add a reference to the instrumentation jar that we built in previous step. Do that in pom.xml:

  <dependency>
  <groupId>com.example</groupId>
  <artifactId>instrumentation</artifactId>
  <version>1.0-SNAPSHOT</version>
  </dependency>

By installing the jar in the Maven repository in previous step (mvn install), Maven will now be able to find it in your main application when you try to build (compile) it.

Now just call ObjectSizeFetcher.getObjectSize to get the bytes consumed by an object in your application. ObjectSizeFetcher.getObjectSize works like the sizeof operator in C#.

You are now ready to run your main app. There is one gotcha. You can’t run your app in the traditional way. We have to use a javaagent. The Maven command will look like:

$ MAVEN_OPTS="-javaagent:$PWD/src/main/resources/instrumentation-1.0-SNAPSHOT.jar -enableassertions" \
mvn exec:java -Dexec.mainClass=my.main.Class -Dexec.cleanupDaemonThreads=false -Dexec.args="some argument"

Replace $PWD/src/main/resources/instrumentation-1.0-SNAPSHOT.jar with the full path where the instrumentation jar can be found. In my case I stored a copy of the jar in the src/main/resources folder of the main app.

If you followed the steps correctly, it should work.

Advanced

To measure the deep size of an object (we have to traverse the object graph for that) you can try using memory-measurer. There are couple of issues though. First, the project is built with Ant. You will need to convert to Maven (optional). Second and more importantly I couldn’t get it to work with Maven. The details are here. The problem is that this project uses dependencies (the instrumentation project we created has zero dependencies) and when using the mvn exec:java plugin to execute a Java application, the exec:java plugin does not push the classpath of dependencies to the javaagent. Let me know if you are able to get it to work.

Discussion

One cannot help but wonder why do we need to build a separate assembly and run it as a Java agent to measure memory usage? Why can’t we write a method that lives in the main application and returns memory usage?

My guess is that the instrumentation API by design is intended to be used to develop programs and applications (call it A) that run standalone and profile other applications (call it B) which act as input (to A) without messing source code of B. B is to be treated as a black-box application whose source code may not even be accessible. B may only be available as a pre-compiled jar file. So the normal (intended) use-case while using the instrumentation API is to call getObjectSize from A. The code in A would be calling getObjectSize to profile B. B is not supposed to access the instrumentation API. Calling the instrumentation API from B is a hacky way to get the object size. We don’t have any other way to get object size in Java so we leverage the hacky solution.

Btw if you think about it, its not that difficult to write a getObjectSize method that does not rely on the instrumentation API to measure memory consumed by an object. Use reflection to get the child objects and call getObjectSize on them recursively to calculate the total memory consumed. The implementation is left as an exercise for the reader.

Update 2023-9-7

Its 2023-9-7 and above steps no longer work on my new computer (Mac OS AArch64 w/ JDK-20) [1]. I tried both Oracle JDK and OpenJDK with no luck. I verified they still work on my old computer (Mac OS Intel x64 w/ JDK-17). Why? I don’t know. The only explanation I can think of is that maybe you shouldn’t be accessing java.lang.Instrumentation in your application code. If it works, its a bonus not something that is guaranteed. Another reason to hate Java. I was able to get around by instead using this code to calculate the object size. The caveat with this alternative is that it only works on the HotSpot VM (so it won’t work with OpenJDK for example). Another gotcha is that you might run into this exception (or something similar):

Caused by: java.lang.reflect.InaccessibleObjectException: Unable to make field transient java.util.HashMap$Node[] java.util.HashMap.table accessible: module java.base does not "opens java.util" to unnamed module @31a07685
    at java.lang.reflect.AccessibleObject.throwInaccessibleObjectException (AccessibleObject.java:387)
    at java.lang.reflect.AccessibleObject.checkCanSetAccessible (AccessibleObject.java:363)
    at java.lang.reflect.AccessibleObject.checkCanSetAccessible (AccessibleObject.java:311)
    at java.lang.reflect.Field.checkCanSetAccessible (Field.java:181)
    at java.lang.reflect.Field.setAccessible (Field.java:175)
    at com.mycompany.app.ObjectSizeCalculator$ClassSizeInfo.<init> (ObjectSizeCalculator.java:404)
    at com.mycompany.app.ObjectSizeCalculator.getClassSizeInfo (ObjectSizeCalculator.java:293)
    at com.mycompany.app.ObjectSizeCalculator.visit (ObjectSizeCalculator.java:311)
    at com.mycompany.app.ObjectSizeCalculator.calculateObjectSize (ObjectSizeCalculator.java:269)
    at com.mycompany.app.ObjectSizeCalculator.getObjectSize (ObjectSizeCalculator.java:209)

The fix as I found after several hours of debugging is to add following flags to your MAVEN_OPTS or java command:

--add-opens java.base/java.util.concurrent=ALL-UNNAMED --add-opens java.base/java.util.concurrent.atomic=ALL-UNNAMED --add-opens java.base/java.util.concurrent.locks=ALL-UNNAMED

Nothing ever works smoothly in Java.

Automatically opening core modules to the unnamed module

Chances are if you are using this code to calculate the object size, you will run into an endless series of

module xx does not opens xxx to unnamed module

You will fix one, then run into another and so on. Is there a way we could open everything? Luckily I found a solution here.

public static void openModulesForReflection() throws InvocationTargetException, IllegalAccessException, NoSuchMethodException, NoSuchFieldException {
    final Module unnamedModule = AddAllOpens.class.getClassLoader().getUnnamedModule();
    final Method method = Module.class.getDeclaredMethod( "implAddExportsOrOpens", String.class, Module.class, boolean.class, boolean.class );
    method.setAccessible( true );

    ModuleLayer.boot().modules().forEach( module -> {
        try {
            final Set<String> packages = module.getPackages();
            for( String eachPackage : packages ) {
                method.invoke( module, eachPackage, unnamedModule, true, true );
                log.info( "--add-open " + module.getName() + "/" + eachPackage + "=" + unnamedModule.toString() );
            }
        } catch( IllegalAccessException | InvocationTargetException e ) {
            throw new RuntimeException( e );
        }
    } );
}

With this, you just have to --add-opens java.base/java.lang=ALL-UNNAMED on the command line. The other --add-opens will be added dynamically for you [1]. Give it a try.

More

Posted in Computers, programming, Software | Tagged | Leave a comment

Load testing a web application using JMeter

This post describes what I learnt re: how to load test a web application using JMeter. The first step is to install JMeter (and its dependencies – JDK) which is not covered here.

Assuming you have JMeter installed (I installed it under ~/Library), first open the program by running:

$ ~/Library/apache-jmeter-5.5/bin/jmeter

Create Thread Group

The first step is to create a new test plan which JMeter does automatically. Within a test plan we create a new thread group. See below for how to do that.

A thread group simulates the users accessing your application. As example:

Here we are simulating 10 users (the Number of Threads) accessing the application. JMeter will create an independent thread for each user. The Ramp-up period controls the rate at which threads will be created. So when we set Ramp-up period (seconds) = Number of Threads then a thread is created per second and it takes the Ramp-up period (seconds) for all threads to become Active. Having a Ramp-up period allows us to see some interesting statistics such as the response time vs. # of active threads.

Once we have decided on the number of threads and ramp-up time, the next thing to decide is if we want the threads to make a certain number of requests (which is done by specifying a Loop Count) or if we want the threads to run for a certain time duration (which is done by checking the LoopCount: Infinite checkbox, also check the Specify Thread lifetime and specify the duration for which threads should run under Duration (seconds)). The above example shows how to let the threads run for a set amount of time (300s or 5 minutes).

Also pay attention to Action to be taken after a Sampler error. In above we have decided to continue running the test.

HTTP Request Sampler

Now we can right click on Thread Group and go to Add -> Sampler -> HTTP Request.

Samplers tell JMeter how to sample an application. For a web application, we sample it by making HTTP requests so we add a HTTP Request sampler. An example configuration is shown below.

Under Server Name or IP enter the domain name of the site or the IP address of the server you want to test. The specific page or path that you want to test is specified under Path. You can also set whether you want to make GET or POST request, http or https as well as request parameters. Depending on your use-case you may want to check Follow Redirects (you decide). Under the Advanced tab you can set Connect and Response timeouts. Example below:

Any cookies you want to set is done separately.

Add Cookie Manager

To add cookies to your http requests, right-click on Thread Group and goto Add -> Config Element -> HTTP Cookie Manager. Note you can also right-click on the Test Plan to add a Cookie Manager at the Test Plan level.

On the Cookie Manager screen, use the Add, Delete, Load and Save buttons to add and delete cookies, load them from a text file or save to a text file. In below I have set an example cookie:

Don’t forget the add the Domain to which this cookie applies. If you don’t set the Domain, no cookie will be sent with your request. For more fine-grained control, also set the Path. The cookie will be sent only if the request path matches the given Path.

HTTP Header Manager

To se any request headers add a HTTP Header Manager. Right-click on Thread Group and goto Add -> Config Element -> HTTP Header Manager. Note you can also right-click on the Test Plan to add a Header Manager at the Test Plan level.

Now set any headers you want to be accompanied by your requests. Like cookies, JMeter allows you to load headers from a text file or save them to a text file for later use. Below is example illustration.

This should take care of most commonly needed requirements. For added bonus, look at HTTP Cache Manager config element. The HTTP Request Defaults allows to set default settings for every HTTP Request.

Our next step is to add Assertions which will verify the HTTP Response we get back from the server. JMeter provides us with many assertions. We will cover some of them below.

Response Assertion

Right-click Test Plan and goto Add -> Assertions -> Response Assertion.

Next configure it the way you like. E.g., if you want to check the response is 200 OK you can do that as follows by checking Response Code Equals and specify 200 in the Patterns to Test:

Pay close attention to the option you have selected under Apply To. In above we have selected Main Sample Only.

Duration Assertion

Next we will add a Duration Assertion which will fail the request if the response time exceeds a certain threshold. Example below:

Size Assertion

we can also add a Size Assertion to verify the response meets certain size criteria. Example below:

JSON Assertion

Suppose you are testing an endpoint that returns a JSON response. You can add a JSON assertion to verify the response is JSON (with a caveat). As example

The JSON Path is used to assert that the JSON contains certain field(s). To my knowledge, it is not possible to just test if response is valid JSON (caveat). If you are able to do that, let me know how. The JSON Assertion has high CPU cost (beware).

You might be thinking we are done now but we aren’t. Next we need to add listeners.

Listeners

Add them like below Add -> Listener -> ...:

The listeners allow you to configure what details JMeter will capture about the responses. If you are new, start by adding Summary Report, View Results Tree and View Results in Table. View Results Tree will display the most exhaustive information and is similar to what you find in Chrome Dev Tools. It will be helpful in debugging the responses. If you are making a lot of requests you may run into Out of memory exception with the View Results Tree.

You can now start your test by clicking on the green Play button on the top ribbon. Try it out and see what you get.

The way JMeter is supposed to be used is that you use the GUI to configure your test (writing XML is hard) and debug your configuration. Once you have a working configuration, save it as XML file by clicking on the Save button in the top ribbon and then for actual test run JMeter in CLI mode. We can do it now but before that we come to perhaps the most interesting thing.

Timers

The purpose of a load test is to determine the breaking point of an application. A web application has two breaking points – the max # of concurrent requests (users) it can handle and the max requests per second it can handle. We need to find both. Finding one is not enough.

When a request comes in, it is processed by a thread. As more and more requests come in they will start consuming more and more threads. Ultimately a point will come when there is no thread available to serve an incoming request. When this happens you have reached the max # of concurrent requests (users) the application can handle. To identify this limit, we need to subject the application under test to a spiking load.

The other kind of failure that happens is when the time it takes to process a request exceeds the time interval at which requests are coming. In this case the requests will get backlogged and again a point will come when there is no thread available to serve a request. To identify this limit, we need to subject the application under test to a uniform (i.e., steady) load.

How do we subject the application to a spiking or uniform load? We do that using timers.

Synchronized Timer

A synchronized timer as its name suggests is used to synchronize the time when the JMeter threads emit requests. This allows us to simulate a spiking load. The timer causes threads to wait until all responses have arrived before firing again with next batch of requests. Add the timer as follows (Add -> Timer -> Synchronizing Timer):

Read documentation on how to configure it.

Constant Throughput Timer

This timer allows us to simulate a uniform load. The timer will delay any requests so as not to exceed the specified target throughput. In this sense, the target throughput is the upper bound on the RPS. If the application cannot handle the target throughput, the actual RPS you get will be lower.

Read documentation on how to configure it. Under Calculate Throughput based on make sure you select one of the variants of all active threads.

JMeter will allow you to add both timers to a test plan but you should only add one at a time. I have never tried running a test plan with more than one timer. I recommend testing with 3 configurations: one without using any timer (each thread makes requests as fast as it can), one with a synchronizing timer which will be used to identify the max # of concurrent users (requests) the application can handle and another with a constant throughput timer which will be used to identify the max RPS the application can handle. Save the configs as jmx files (XML).

CLI Mode

JMeter is invoked in CLI mode with following minimal command that you can put in a bash script:

HEAP="-Xms1g -Xmx1g -XX:MaxMetaspaceSize=256m" \
$HOME/Library/apache-jmeter-5.5/bin/jmeter -n \
-t $1 \
-l $2 \
-e \
-o $3

$1 is name of jmx file. $2 is where it will save the log file that will contain information about every request. $3 is a directory where it will save results. It will display a nice summary as it runs. Example:

./run-jmeter.sh 20u_50l.jmx 20u_50l.log 20u_50l
WARNING: package sun.awt.X11 not in java.desktop
Creating summariser <summary>
Created the tree successfully using 20u_50l.jmx
Starting standalone test @ 2022 Aug 3 12:32:11 PDT (1659555131994)
Waiting for possible Shutdown/StopTestNow/HeapDump/ThreadDump message on port 4445
Warning: Nashorn engine is planned to be removed from a future JDK release
summary +      1 in 00:00:23 =    0.0/s Avg:  3396 Min:  3396 Max:  3396 Err:     0 (0.00%) Active: 20 Started: 20 Finished: 0
summary +    100 in 00:00:25 =    3.9/s Avg:  4534 Min:  3029 Max:  5259 Err:     0 (0.00%) Active: 20 Started: 20 Finished: 0
summary =    101 in 00:00:48 =    2.1/s Avg:  4523 Min:  3029 Max:  5259 Err:     0 (0.00%)
summary +     80 in 00:00:33 =    2.4/s Avg:  5924 Min:  3238 Max: 10109 Err:    21 (26.25%) Active: 20 Started: 20 Finished: 0
summary =    181 in 00:01:21 =    2.2/s Avg:  5142 Min:  3029 Max: 10109 Err:    21 (11.60%)
summary +    100 in 00:00:29 =    3.4/s Avg:  6131 Min:   734 Max: 10127 Err:   100 (100.00%) Active: 20 Started: 20 Finished: 0
summary =    281 in 00:01:50 =    2.6/s Avg:  5494 Min:   734 Max: 10127 Err:   121 (43.06%)
summary +    180 in 00:00:28 =    6.5/s Avg:  3061 Min:  3048 Max:  3073 Err:   180 (100.00%) Active: 20 Started: 20 Finished: 0
summary =    461 in 00:02:18 =    3.3/s Avg:  4544 Min:   734 Max: 10127 Err:   301 (65.29%)
summary +    200 in 00:00:31 =    6.5/s Avg:  3062 Min:  3047 Max:  3076 Err:   200 (100.00%) Active: 20 Started: 20 Finished: 0
summary =    661 in 00:02:49 =    3.9/s Avg:  4096 Min:   734 Max: 10127 Err:   501 (75.79%)
summary +    200 in 00:00:31 =    6.5/s Avg:  3062 Min:  3050 Max:  3073 Err:   200 (100.00%) Active: 20 Started: 20 Finished: 0
summary =    861 in 00:03:19 =    4.3/s Avg:  3856 Min:   734 Max: 10127 Err:   701 (81.42%)
summary +    139 in 00:00:18 =    7.5/s Avg:  3060 Min:  3040 Max:  3083 Err:   139 (100.00%) Active: 0 Started: 20 Finished: 20
summary =   1000 in 00:03:38 =    4.6/s Avg:  3745 Min:   734 Max: 10127 Err:   840 (84.00%)
Tidying up ...    @ 2022 Aug 3 12:35:50 PDT (1659555350018)
... end of run

Now open the index.html under the results directory to see all the juicy information and let me know how it goes. Two graphs I find especially useful are response time vs # of active threads (/content/pages/ResponseTimes.html#timeVsThreads) and response time vs. requests per second (/content/pages/Throughput.html#responseTimeVsRequest)

Avg. Response time vs # of active threads
Response time vs requests per second

There is a ton of other useful information as well.

Using a CSV file to provide body data

One incredibly useful feature is the CSV Data Set Config that allows you to provide a CSV file that can contain the content you want to send to the server. This way you can avoid sending the same request again and again. E.g., say you want to hit an endpoint that should create a new record (e.g., a book in a library). You can provide the data in a CSV file. Highly recommend to check this out.

As a case study, assuming you want to divide the lines in the file across the threads (so no two threads use the same message in the file – that would lead to duplicate requests), in your test plan, you should set

<stringProp name="shareMode">shareMode.all</stringProp>

this setting is under CSVDataSet config element. You should also divide the number of lines by the number of threads and set LoopController.loops equal to that value. E.g., if my CSV file contains 1000 lines and I am running JMeter with 4 threads, each thread will need to make 1000/4=250 requests:

<stringProp name="LoopController.loops">250</stringProp>

The LoopController.continue_forever is set to false so threads will terminate after making 250 requests each.

<boolProp name="LoopController.continue_forever">false</boolProp>

The other setting of interest is Argument.value. In below:

<HTTPSamplerProxy guiclass="HttpTestSampleGui" testclass="HTTPSamplerProxy" testname="HTTP Request" enabled="true">
          <boolProp name="HTTPSampler.postBodyRaw">true</boolProp>
          <elementProp name="HTTPsampler.Arguments" elementType="Arguments">
            <collectionProp name="Arguments.arguments">
              <elementProp name="" elementType="HTTPArgument">
                <boolProp name="HTTPArgument.always_encode">false</boolProp>
                <stringProp name="Argument.value">
  ${message}
</stringProp>
                <stringProp name="Argument.metadata">=</stringProp>
              </elementProp>
            </collectionProp>
          </elementProp>
<stringProp name="HTTPSampler.domain">microsoft.com</stringProp>
          <stringProp name="HTTPSampler.port">443</stringProp>
          <stringProp name="HTTPSampler.protocol">https</stringProp>
          <stringProp name="HTTPSampler.contentEncoding"></stringProp>
          <stringProp name="HTTPSampler.path">/path/to/something</stringProp>
          <stringProp name="HTTPSampler.method">POST</stringProp>
          <boolProp name="HTTPSampler.follow_redirects">true</boolProp>

we have configured JMeter to make POST requests to microsoft.com/path/to/something and the body of the POST request will contain the line from the CSV file. This is set using ${message} in code above.

Under CSVDataSet I have:

<stringProp name="variableNames">message</stringProp>

and we reference it as ${message} in the HTTPSamplerProxy element.

Troubleshooting

Where are the logs?

If you are using JMeter 5.5 a jmeter.log file should be generated in the same directory from where you launch jmeter.

Where is the config?

You can find two config files jmeter.properties and user.properties under the bin folder of the directory where you installed jmeter

Posted in Computers, programming, Software | Tagged | Leave a comment