
This post describes results of a test to compare the performance of MySQL vs. Postgres on the TPC-C Benchmark for OLTP workloads. The tool used for performance benchmarking was sysbench-tpcc. Note that sysbench-tpcc simulates a TPC-C like workload not exactly TPC-C. The results cannot be compared to official benchmark. sysbench-tpcc is not validated and certified by the TPC organization.
That said, for the impatient the performance was the same across MySQL and Postgres with very little difference. Both gave a TPS of 50 tx/s on a machine with 8 vCPU and 32 GB RAM. I felt this was quite remarkable. Details follow.
Install sysbench:
$ curl -s https://packagecloud.io/install/repositories/akopytov/sysbench/script.deb.sh | sudo bash
it gets installed under /usr/bin/sysbench.
MySQL
First, a MySQL 8.0 server was provisioned in Google Cloud SQL with 8 vCPU and 32 GB RAM. Create database and grant privileges:
mysql> CREATE DATABASE sysbench;
mysql> GRANT ALL PRIVILEGES ON sysbench.* TO 'sysbench'@'%';
Data was loaded onto the server using following command:
./tpcc.lua \
--mysql-host= \
--mysql-port=3306 \
--mysql-user=sysbench \
--mysql-db=sysbench \
--mysql-password= \
--db-driver=mysql \
--time=300 \
--threads=64 \
--report-interval=1 \
--tables=10 \
--scale=100 \
--use_fk=0 \
--trx_level=RC \
prepare
The command took 45 min to run. It generates about 1000 tables. To calculate the total size first we have to compute statistics:
mysql> use sysbench;
SET @tables = NULL;
SELECT GROUP_CONCAT(table_name) INTO @tables
FROM information_schema.tables
WHERE table_schema = 'sysbench';
SET @tables = CONCAT('ANALYZE TABLE ', @tables);
PREPARE stmt FROM @tables;
EXECUTE stmt;
DEALLOCATE PREPARE stmt;
Then we can get cumulative data size:
mysql> SELECT SUM(data_length + index_length) / 1024 / 1024 AS 'DB Size (MB)' FROM information_schema.tables WHERE table_schema = 'sysbench';
+-----------------+
| DB Size (MB)    |
+-----------------+
| 325088.09375000 |
+-----------------+
1 row in set (0.04 sec) --> This is 3x more than postgres as we see later

mysql> SELECT SUM(data_length) / 1024 / 1024 AS 'DB Size (MB)' FROM information_schema.tables WHERE table_schema = 'sysbench';

+-----------------+
| DB Size (MB)    |
+-----------------+
| 294732.06250000 |
+-----------------+
1 row in set (0.04 sec)

mysql> SELECT SUM(index_length) / 1024 / 1024 AS 'DB Size (MB)' FROM information_schema.tables WHERE table_schema = 'sysbench'
;
+----------------+
| DB Size (MB)   |
+----------------+
| 30356.03125000 |
+----------------+
1 row in set (0.05 sec)
We keep all the default settings provided by GCP and run the workload using:
./tpcc.lua \
--mysql-host= \
--mysql-port=3306 \
--mysql-user=sysbench \
--mysql-db=sysbench \
--mysql-password= \
--db-driver=mysql \
  --time=3600 \
   --threads=56 \
   --report-interval=1 \
   --tables=10 \
   --scale=100 \
   --use_fk=0 \
   --trx_level=RC \
   run
We end up with:
SQL statistics:
    queries performed:
        read:                            2326755
        write:                           2413153
        other:                           360462
        total:                           5100370
    transactions:                        180147 (50.01 per sec.)
    queries:                             5100370 (1415.85 per sec.)
    ignored errors:                      765    (0.21 per sec.)
    reconnects:                          0      (0.00 per sec.)

General statistics:
    total time:                          3602.3328s
    total number of events:              180147

Latency (ms):
         min:                                  155.75
         avg:                                 1119.35
         max:                                 5499.10
         95th percentile:                     2632.28
         sum:                            201647070.53

Threads fairness:
    events (avg/stddev):           3216.9107/50.78
    execution time (avg/stddev):   3600.8405/0.69
and total data size is now 328,392 MB.
Postgres
First, a Postgres 14.0 server was provisioned in Google Cloud SQL with 8 vCPU and 32 GB RAM. create database and grant privileges:
create database tpcc;

grant all privileges on database tpcc to sysbench;
Data was loaded onto the server using following command:
./tpcc.lua \
--pgsql-host= \
--pgsql-port=5432 \
--pgsql-user=sysbench \
--pgsql-db=sysbench \
--pgsql-password= \
--time=300 \
--threads=64 \
--report-interval=1 \
--tables=10 \
--scale=100 \
--use_fk=0 \
--trx_level=RC \
--db-driver=pgsql \
prepare
The command took more than an hour to run. To calculate the total size:
tpcc=> SELECT pg_size_pretty(pg_database_size('tpcc'));
 pg_size_pretty
----------------
 102 GB
(1 row)
Before running the benchmark we did two things: VACUUM ANALYZE the database:
VACUUM ANALYZE;
VACUUM reclaims storage occupied by dead tuples. In normal PostgreSQL operation, tuples that are deleted or obsoleted by an update are not physically removed from their table; they remain present until a VACUUM is done. Therefore it’s necessary to do VACUUM periodically, especially on frequently-updated tables. In this case since we just created the database it was not necessary.
The second thing we did was to tweak the default settings to following:
gcloud sql instances patch postgres-server-name --zone "zone-name" --project "project-name" --verbosity=debug \
--database-flags=random_page_cost=1,max_wal_size=100000,checkpoint_timeout=3600,checkpoint_completion_target=0.9,autovacuum_vacuum_scale_factor=0.4,min_wal_size=1000,wal_compression=on,log_checkpoints=on
This was done based on what I read here. I think the main thing to note is enabling the wal_compression. Not sure how much of a difference the other settings make. Anyway the test was then run as follows:
./tpcc.lua \
--pgsql-user=sysbench \
 --pgsql-db=tpcc \
  --time=3600 \
   --threads=56 \
   --report-interval=1 \
   --tables=10 \
   --scale=100 \
   --use_fk=0 \
   --trx_level=RC \
   --pgsql-password= \
   --pgsql-host= \
   --pgsql-port=5432 \
   --db-driver=pgsql \
   run
This ran for an hour and gave:
SQL statistics:
    queries performed:
        read:                            2310777
        write:                           2398055
        other:                           356420
        total:                           5065252
    transactions:                        178154 (49.45 per sec.)
    queries:                             5065252 (1405.93 per sec.)
    ignored errors:                      785    (0.22 per sec.)
    reconnects:                          0      (0.00 per sec.)

General statistics:
    total time:                          3602.7877s
    total number of events:              178154

Latency (ms):
         min:                                  155.87
         avg:                                 1131.91
         max:                                 5513.34
         95th percentile:                     2632.28
         sum:                            201655147.95

Threads fairness:
    events (avg/stddev):           3181.3214/45.27
    execution time (avg/stddev):   3600.9848/0.71
So here we are: basically the same TPS! In fact the results are so similar (even the latency is the same) that I had to check I did not mistakenly run both tests on the same database. Which one do you like? The elephant or the dolphin? Let me know in your comments.
Serializable Level
Below are results of MySQL vs Postgres when running with 20 concurrent threads and when transaction isolation level is set to SERIALIZABLE. We use exact same config as before except that --threads=20 and --trx_level=SER
MySQL:
SQL statistics:
    queries performed:
        read:                            827056
        write:                           858380
        other:                           127206
        total:                           1812642
    transactions:                        63573  (17.65 per sec.)
    queries:                             1812642 (503.14 per sec.)
    ignored errors:                      290    (0.08 per sec.)
    reconnects:                          0      (0.00 per sec.)

General statistics:
    total time:                          3602.6817s
    total number of events:              63573

Latency (ms):
         min:                                  156.71
         avg:                                 1132.83
         max:                                 4715.93
         95th percentile:                     2632.28
         sum:                             72017367.32

Threads fairness:
    events (avg/stddev):           3178.6500/42.11
    execution time (avg/stddev):   3600.8684/0.73
Postgres:
SQL statistics:
    queries performed:
        read:                            822696
        write:                           854108
        other:                           127148
        total:                           1803952
    transactions:                        63390  (17.60 per sec.)
    queries:                             1803952 (500.85 per sec.)
    ignored errors:                      445    (0.12 per sec.)
    reconnects:                          0      (0.00 per sec.)

General statistics:
    total time:                          3601.7746s
    total number of events:              63390

Latency (ms):
         min:                                  156.15
         avg:                                 1136.06
         max:                                 5005.31
         95th percentile:                     2680.11
         sum:                             72014634.91

Threads fairness:
    events (avg/stddev):           3169.5000/35.23
    execution time (avg/stddev):   3600.7317/0.59
Again results are practically the same! No difference at all. (The most visible difference is in the errors which is 290 for MySQL vs 445 for Postgres). I had to double-check I did not execute the tests against the same server. And believe me, I did not. I find this quite remarkable because the internals of MySQL and Postgres are subtly different when it comes to storage and managing concurrency. First, MySQL uses a clustered index for its storage whereas Postgres uses a heap. Second, when it comes to managing concurrency at SERIALIZABLE level, MySQL uses a combination of MVCC and 2PL (2 phase locking) whereas Postgres uses Serializable Snapshot Isolation (SSI). And third, MySQL is using a thread per connection whereas Postgres spawns a new process per connection. In terms of memory usage I found Postgres was taking up 21.3 GiB whereas MySQL was taking a little more 26.89 GiB.
Below is a snapshot of sample queries being executed against the database as we run sysbench-tpcc.
DELETE FROM new_orders8 +
WHERE no_o_id = 2114 +
AND no_d_id = 1 +
AND no_w_id = 18
COMMIT
SELECT s_quantity, s_data, s_dist_05 s_dist +
FROM stock10 +
WHERE s_i_id = 80424 AND s_w_id= 77 FOR UPDATE
SELECT s_quantity, s_data, s_dist_10 s_dist +
FROM stock7 +
WHERE s_i_id = 1469 AND s_w_id= 1 FOR UPDATE
SELECT s_quantity, s_data, s_dist_05 s_dist +
FROM stock5 +
WHERE s_i_id = 1875 AND s_w_id= 13 FOR UPDATE
INSERT INTO new_orders6 (no_o_id, no_d_id, no_w_id) +
VALUES (3012,5,58)
UPDATE stock1 +
SET s_quantity = 53 +
WHERE s_i_id = 10556 +
AND s_w_id= 41
SELECT o_c_id +
FROM orders6 +
WHERE o_id = 2115 +
AND o_d_id = 10 +
AND o_w_id = 6
SELECT s_quantity, s_data, s_dist_03 s_dist +
FROM stock6 +
WHERE s_i_id = 50357 AND s_w_id= 17 FOR UPDATE
SELECT no_o_id +
FROM new_orders9 +
WHERE no_d_id = 7 +
AND no_w_id = 31 +
ORDER BY no_o_id ASC LIMIT 1 FOR UPDATE
SELECT i_price, i_name, i_data +
FROM item5 +
WHERE i_id = 48208
INSERT INTO order_line5 +
(ol_o_id, ol_d_id, ol_w_id, ol_number, ol_i_id, ol_supply_w_id, ol_quantity, ol_amount, ol_dist_info)+
VALUES (3011,6,37,13,42417,37,3,55,'dddddddddddddddddddddddd')
SELECT c_first, c_middle, c_last, c_street_1, +
c_street_2, c_city, c_state, c_zip, c_phone, +
c_credit, c_credit_lim, c_discount, c_balance, c_ytd_payment, c_since +
FROM customer7 +
WHERE c_w_id = 92 +
AND c_d_id= 7 +
AND c_id=764 FOR UPDATE
BEGIN
SELECT i_price, i_name, i_data +
FROM item10 +
WHERE i_id = 69582
SELECT i_price, i_name, i_data +
FROM item9 +
WHERE i_id = 71983
INSERT INTO history10 +
(h_c_d_id, h_c_w_id, h_c_id, h_d_id, h_w_id, h_date, h_amount, h_data) +
VALUES (6,67,1559,6,67,NOW(),3072,'name-mzlqb name-cvffw ')
INSERT INTO order_line9 +
(ol_o_id, ol_d_id, ol_w_id, ol_number, ol_i_id, ol_supply_w_id, ol_quantity, ol_amount, ol_dist_info)+
VALUES (3014,2,59,12,84480,59,10,372,'rrrrrrrrrrrrrrrrrrrrrrrr')
UPDATE warehouse2 +
SET w_ytd = w_ytd + 998 +
WHERE w_id = 73
SELECT i_price, i_name, i_data +
FROM item8 +
WHERE i_id = 33257
(21 rows)
Also of interest
below spreadsheet is from this article. The qps.new column tracks performance ratio of PG vs MySQL. Results are similar. Overall the geometric mean is 1.04 reflecting no significant difference between the two.
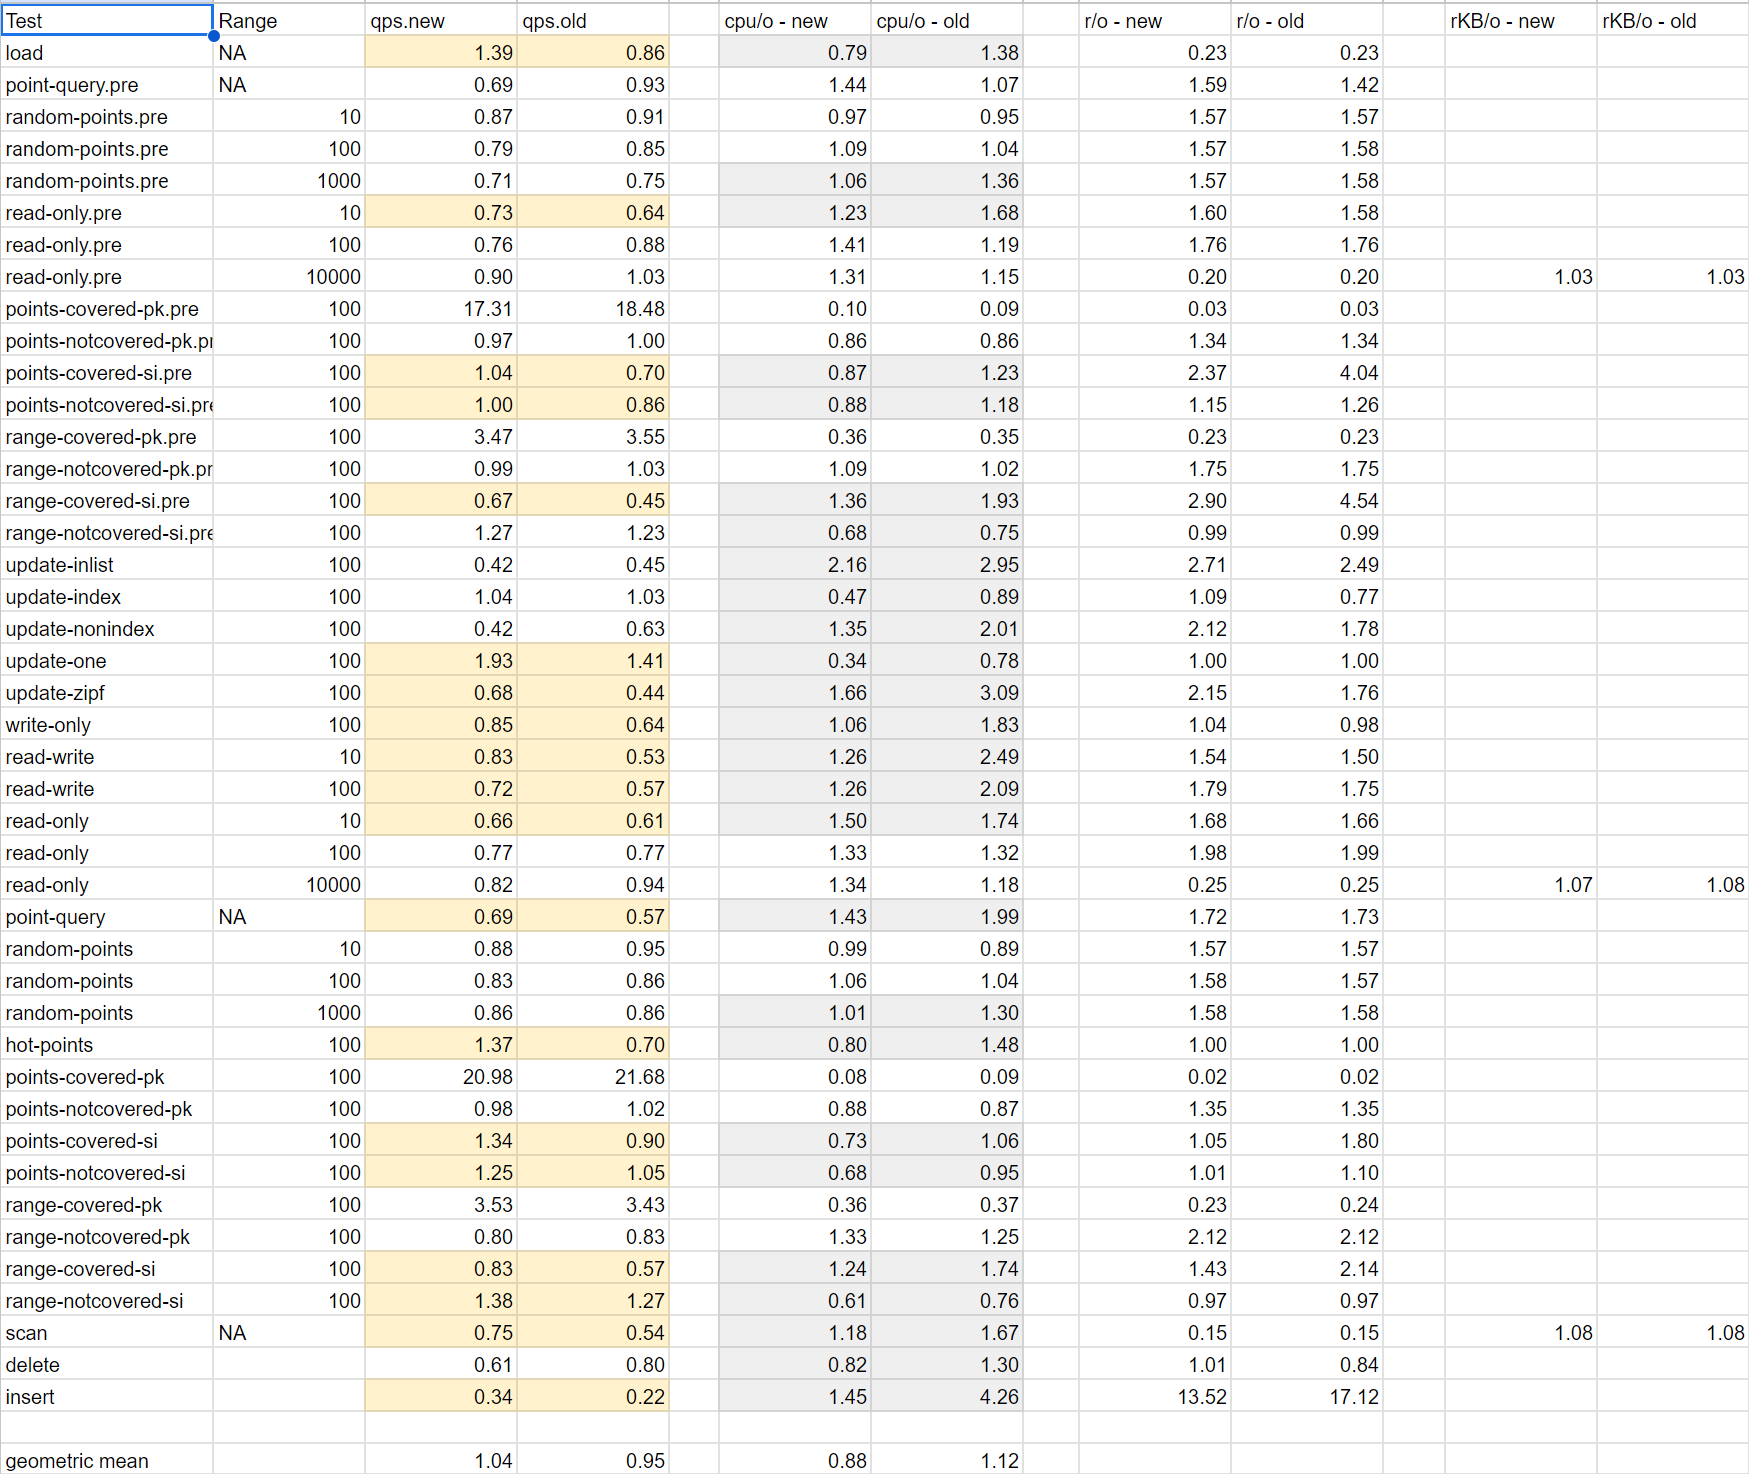
On closer inspection of above spreadsheet, we see most of the time its MySQL that is better. There are a few outliers where PG performs vastly better like points-covered-pk where the ratio is 20. What do we get if we instead take the median of the results?
>>> qps
[1.39, 0.69, 0.87, 0.79, 0.71, 0.73, 0.76, 0.9, 17.31, 0.97, 1.04, 1.0, 3.47, 0.99, 0.67, 1.27, 0.42, 1.04, 0.42, 1.93, 0.68, 0.85, 0.83, 0.72, 0.66, 0.77, 0.82, 0.69, 0.88, 0.83, 0.86, 1.37, 20.98, 0.98, 1.34, 1.25, 3.53, 0.8, 0.83, 1.38, 0.75, 0.61, 0.34]
>>> statistics.median(qps)
0.85
