
VisualVM is a great tool to profile your Java applications. Here I describe the steps I followed to get it working. The steps are wrt Visual VM 2.1.4. I installed VisualVM by downloading the dmg file from their website. Then using it was easy. Just open the application and it will show all the Java processes running on your system. The part where it got challenging was getting it to work with remote applications.
I had a remote application running on a Linux VM in GCP (Google Cloud Platform).
Linux instance-1 5.10.0-15-cloud-amd64 #1 SMP Debian 5.10.120-1 (2022-06-09) x86_64
$ java --version
openjdk 17.0.4 2022-07-19
OpenJDK Runtime Environment (build 17.0.4+8-Debian-1deb11u1)
OpenJDK 64-Bit Server VM (build 17.0.4+8-Debian-1deb11u1, mixed mode, sharing)
Step 1: Run jstatd on the remote VM
On your remote VM, open ~/.bash_profile and edit it so:
function run_jstatd() {
# https://stackoverflow.com/a/15176142/147530
        policy=${HOME}/.jstatd.all.policy
[ -r ${policy} ] || cat >${policy} <<'POLICY'
grant codebase "jrt:/jdk.jstatd" {
permission java.security.AllPermission;
};
grant codebase "jrt:/jdk.internal.jvmstat" {
   permission java.security.AllPermission;
};
POLICY
#https://stackoverflow.com/a/33219226/147530
jstatd -J-Djava.security.policy=${policy} -J-Djava.rmi.server.hostname=x.x.x.x -J-Djava.net.preferIPv4Stack=true -J-Djava.rmi.server.logCalls=true &
}
Save it and reload it by running:
$ exec -l $SHELLThen run:
$ run_jstatdVerify jstatd is correctly running:
$ ss -tpln
State      Recv-Q     Send-Q         Local Address:Port          Peer Address:Port     Process
LISTEN     0          80                 127.0.0.1:3306               0.0.0.0:*
LISTEN     0          50                   0.0.0.0:41013              0.0.0.0:*         users:(("jstatd",pid=768055,fd=9))
LISTEN     0          128                  0.0.0.0:22                 0.0.0.0:*
LISTEN     0          50                         *:43331                    *:*         users:(("java",pid=768189,fd=14))
LISTEN     0          50                         *:1099                     *:*         users:(("jstatd",pid=761237,fd=11))
LISTEN     0          50                         *:36175                    *:*         users:(("jstatd",pid=767916,fd=9))
LISTEN     0          50                         *:37199                    *:*         users:(("jstatd",pid=761237,fd=9))
You may see less or more output but usually port 1099 will be in the list as that seems to be the default port it uses.
Now as per docs you can connect VisualVM to the remote VM. However it didn’t work for me and kept me occupied for a long time. The trick was the next step…
Open up firewall to port 1099
Check on your client machine that you are able to connect to port 1099:
$ nc -zv x.x.x.x 1099This will give a timeout if port 1099 is blocked by a firewall as was in my case. To open this port in GCP there are two things you need to do. Below is assuming your VM is in a VPC network. The steps will need to be modified if VM is not in a VPC Network:
- First, edit your VM and associate a network tag to it. I used the tag
visualvm-monitoring. You can name the tag anything you want. You will need it in the next step. - Then, goto VPC Network and create a rule. Here you will use the tag in step 1
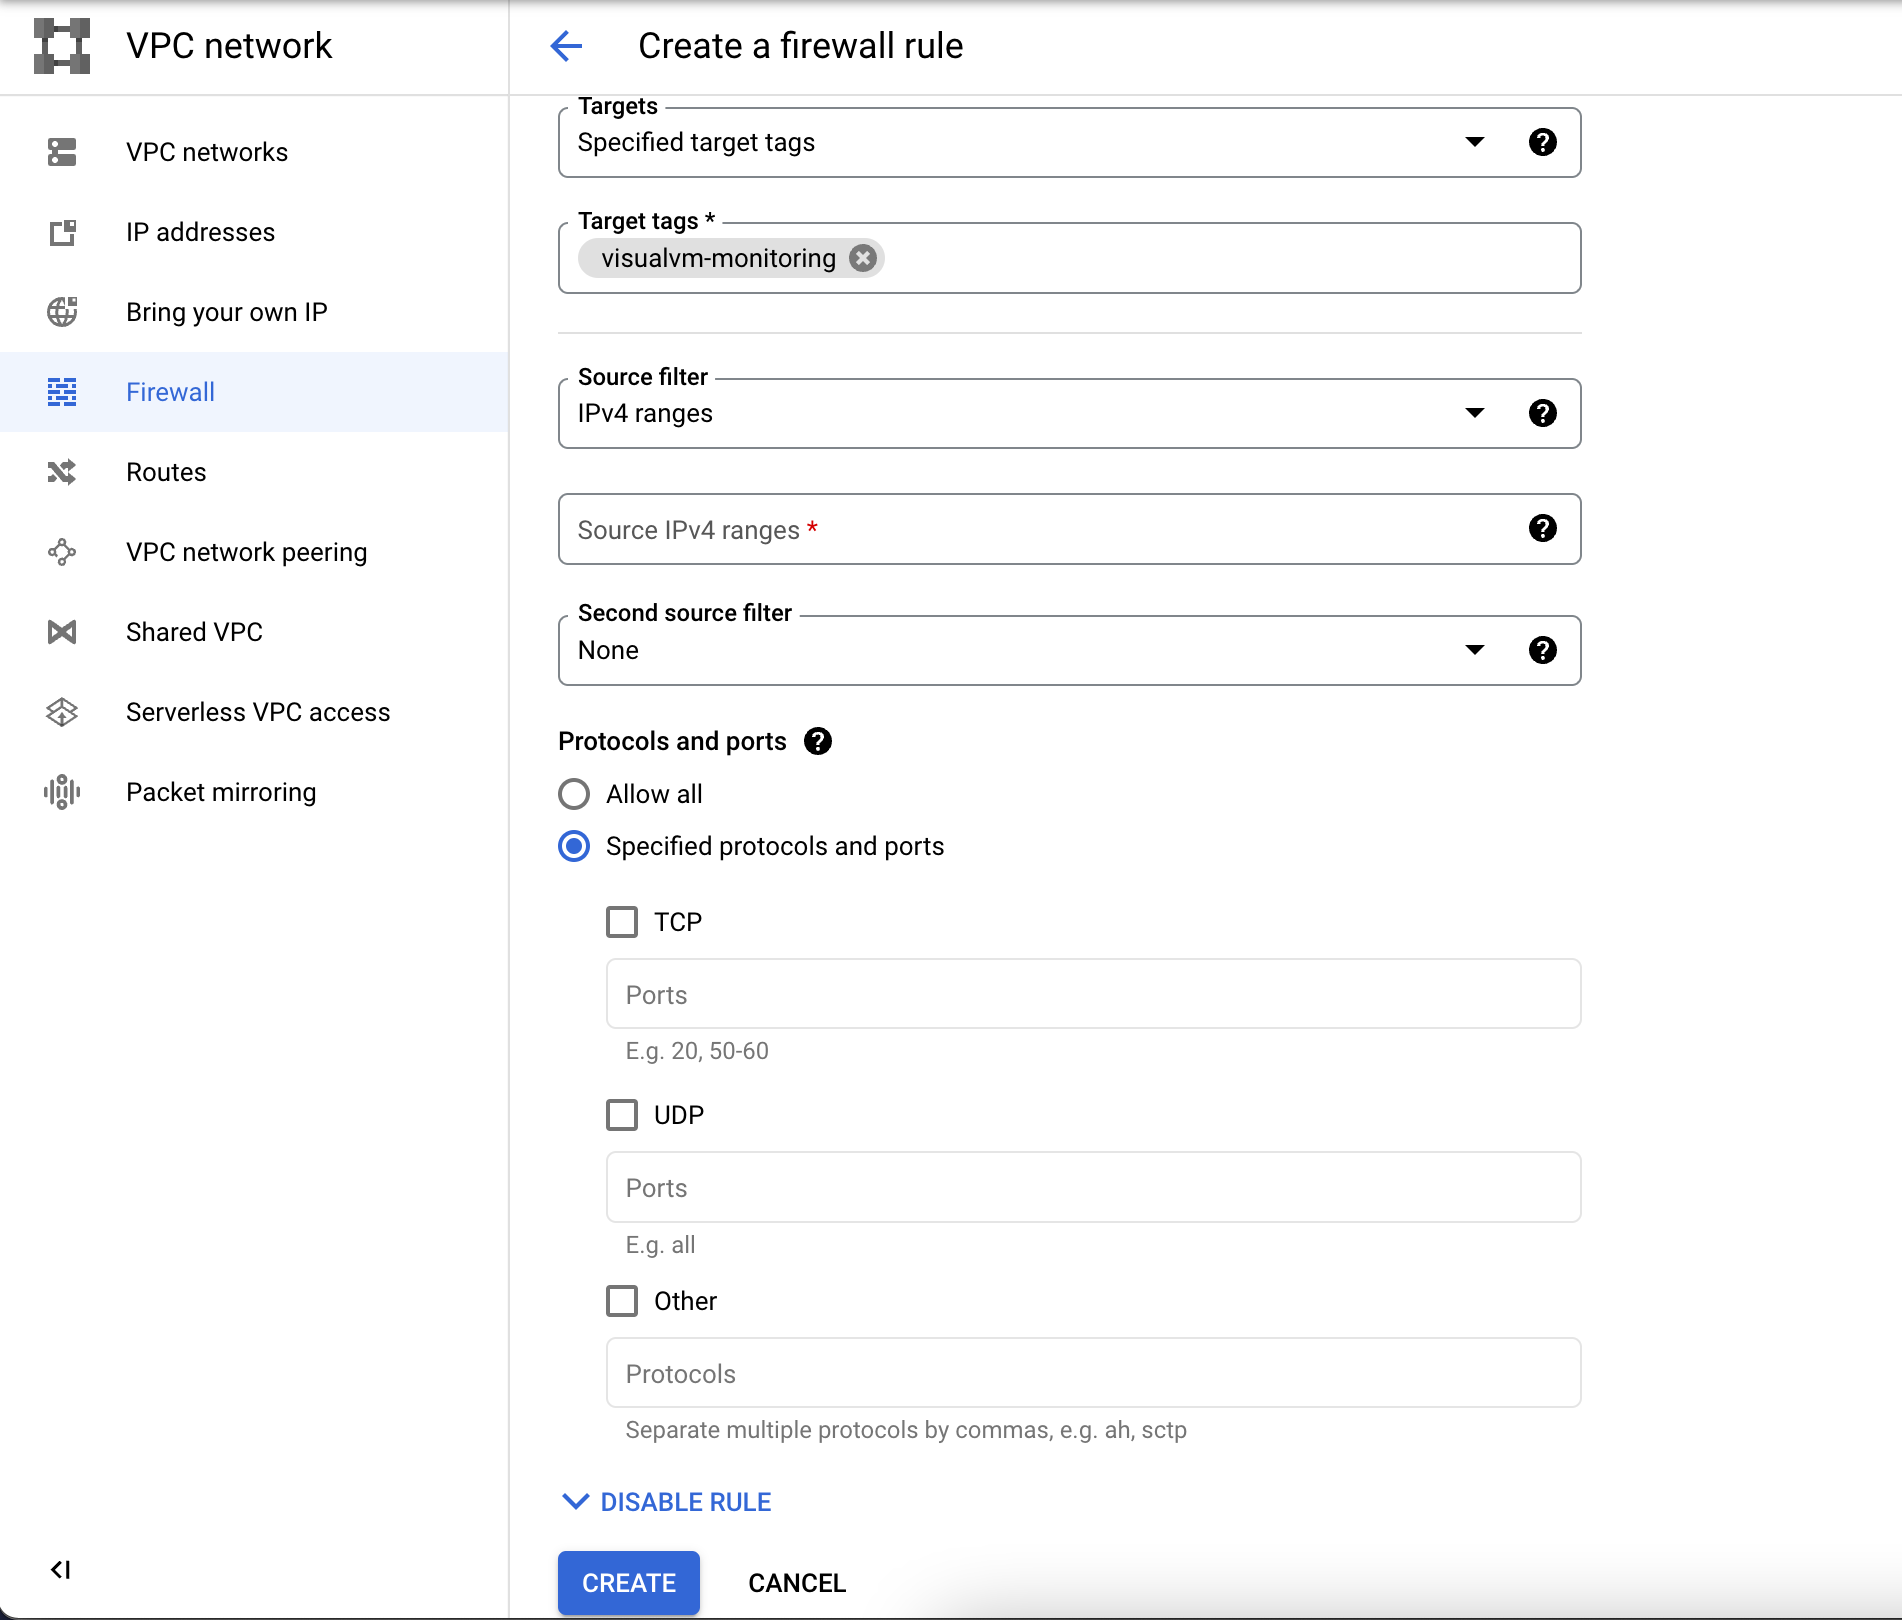
The command line to do it looks as follows:
$ gcloud compute --project=xxx firewall-rules create allow-1099 --description="Allow port 1099 for VisualVM" --direction=INGRESS --priority=1000 --network=default --action=ALLOW --rules=all --source-ranges=0.0.0.0/0 --target-tags=visualvm-monitoringOnce you have opened up the port nc should be able to connect to it. This really was the biggest stumbling piece for me.
Add remote host to Visual VM
Steps to do this are documented. To add a remote host, right-click the Remote node in the Applications window, choose Add Remote Host and type the host name or IP address in the Add Remote Host dialog box. (You can also specify a display name that will be used to refer to the host when listed under the Remote node.)
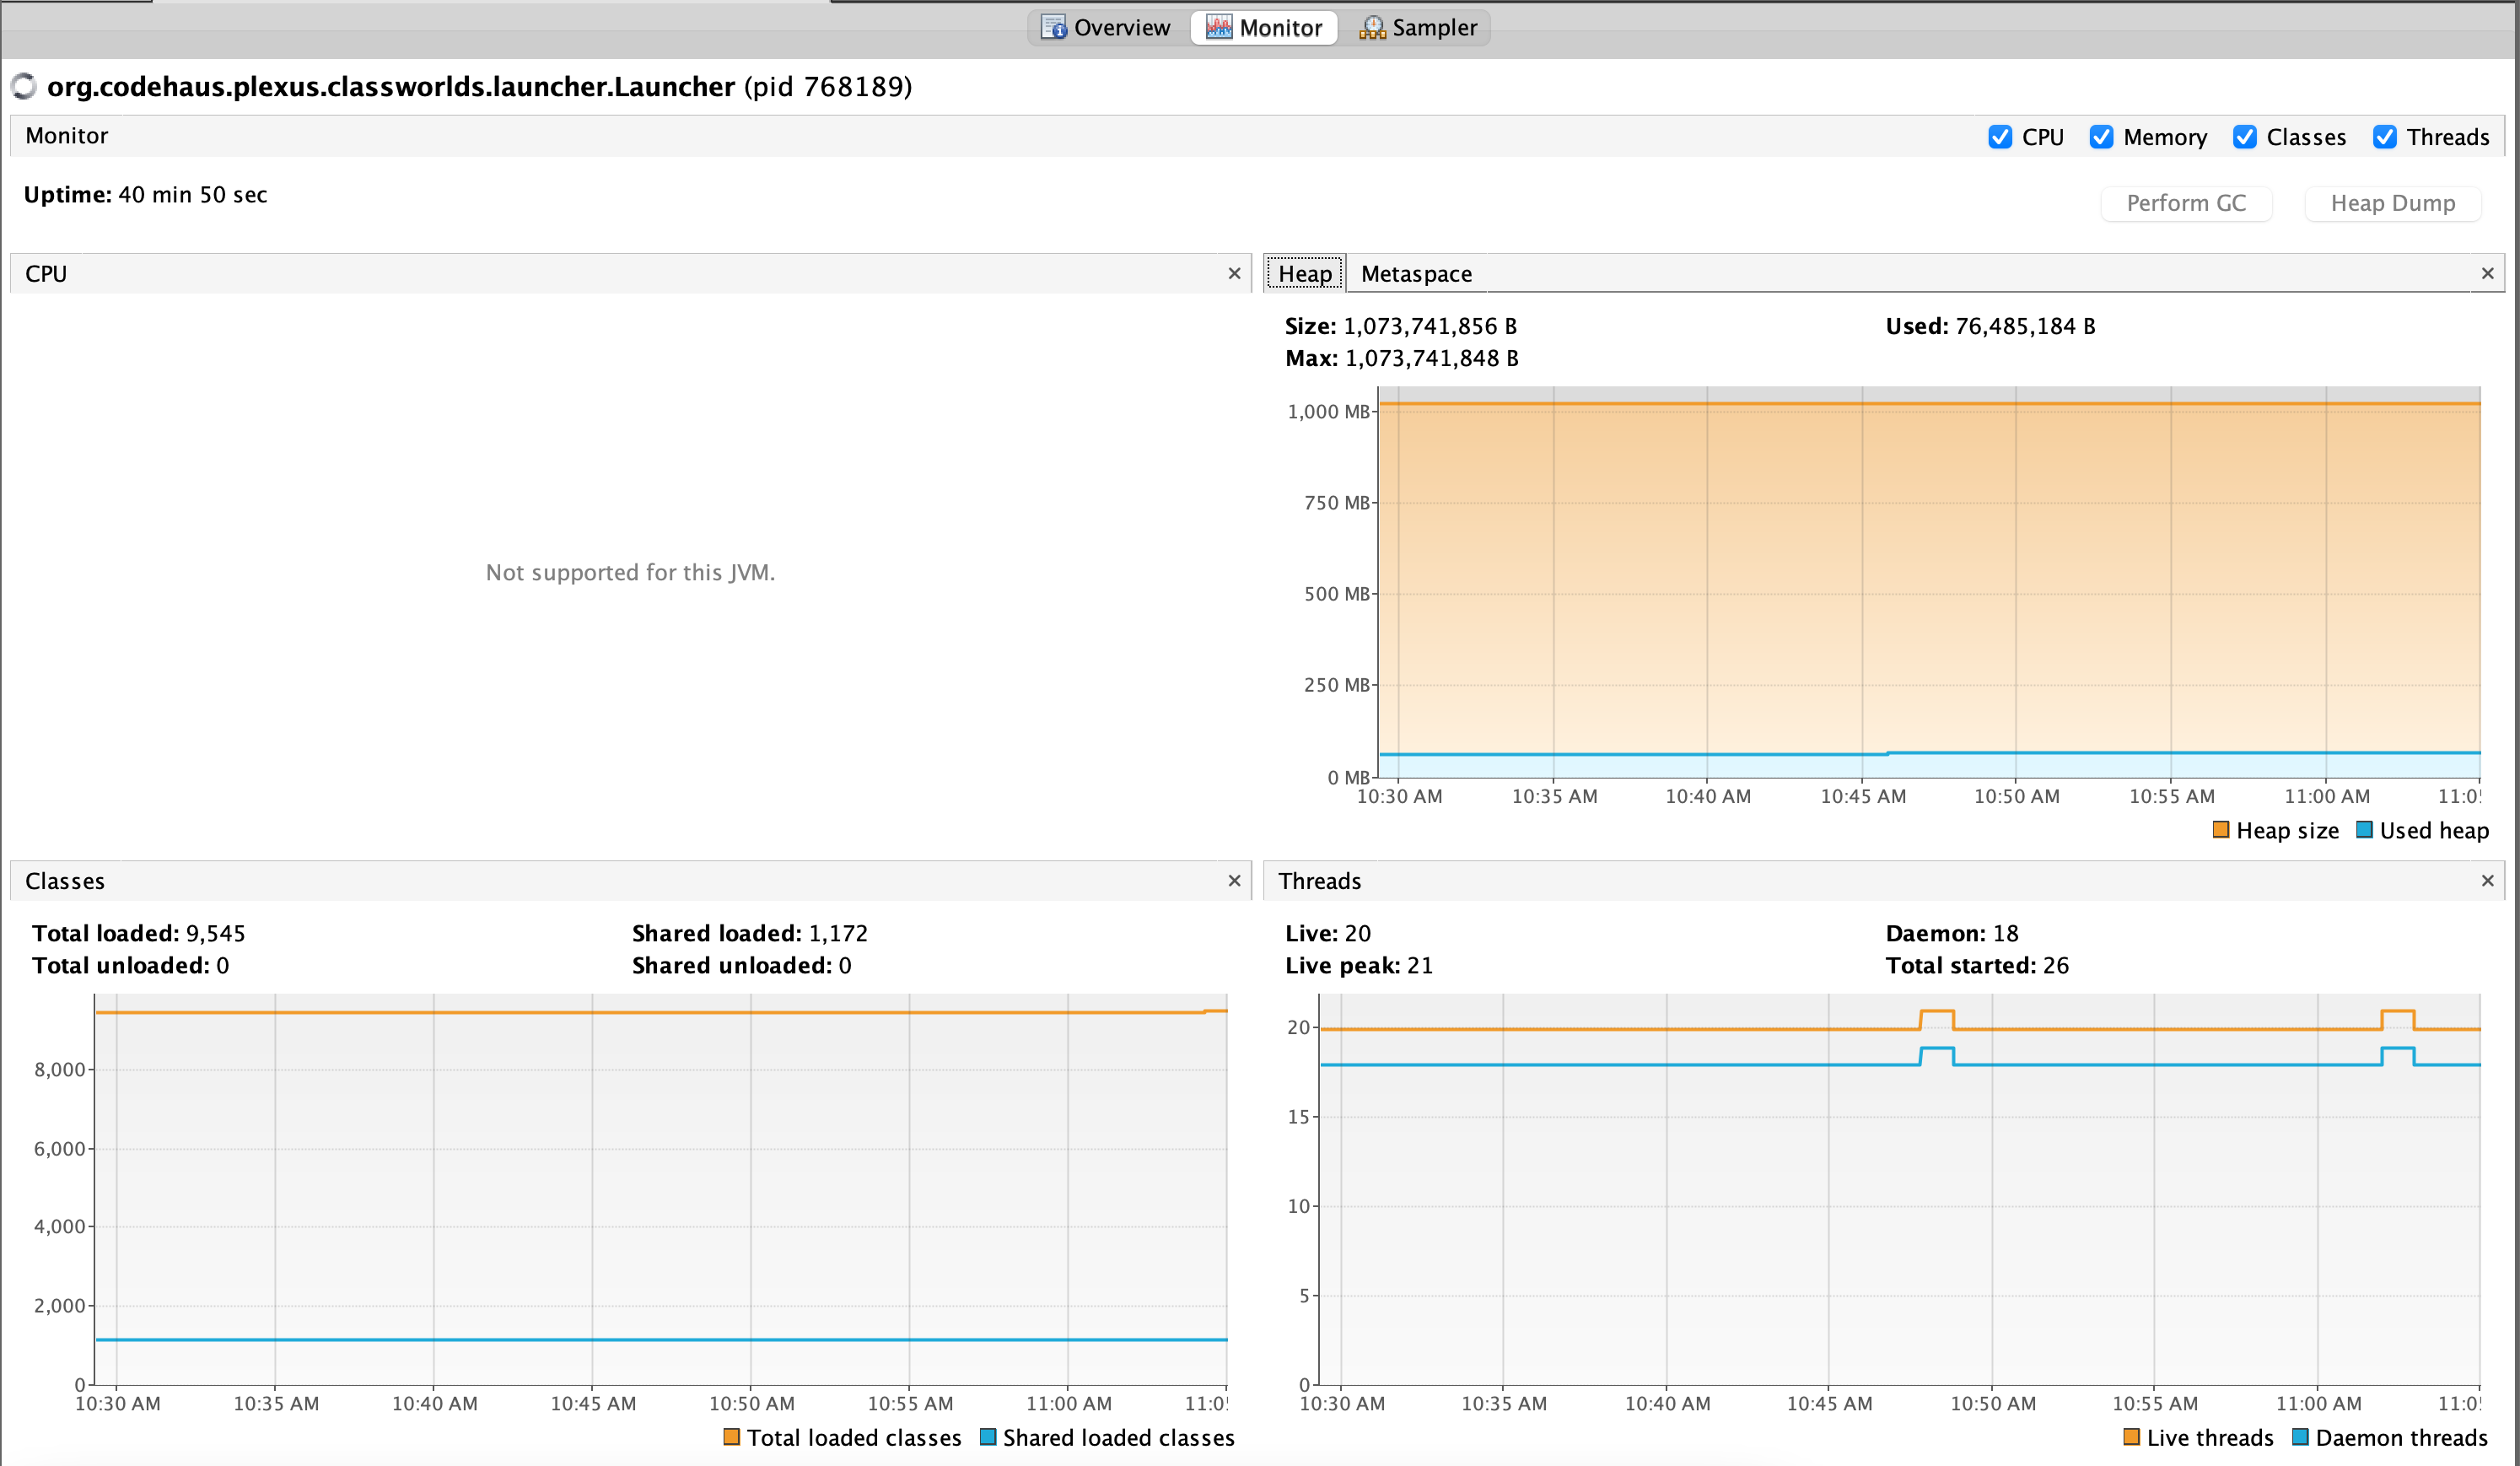
And Viola! It works!
On the remote machine, I did see a constant stream of
FINER: RMI TCP Connection(16)-x.x.x.x: [x.x.x.x: sun.tools.jstatd.RemoteVmImpl[4ba38792:183474326e5:-7ff6, -3395430355800016994]: public abstract byte[] sun.jvmstat.monitor.remote.RemoteVm.getBytes() throws java.rmi.RemoteException]
Sep 16, 2022 6:13:33 PM sun.rmi.server.UnicastServerRef dispatch
FINER: RMI TCP Connection(16)-x.x.x.x: [x.x.x.x: sun.tools.jstatd.RemoteHostImpl[4ba38792:183474326e5:-7fff, -6901610018974223180]: public abstract int[] sun.jvmstat.monitor.remote.RemoteHost.activeVms() throws java.rmi.RemoteException,sun.jvmstat.monitor.MonitorException]
The only missing piece (and unfortunately the reason I wanted to use VisualVM) is the Threads view that I was not able to get working. I was esp. interested in it because I wanted to see how many threads are blocked when I make calls to MySQL in my Spring app. I tried running my program with
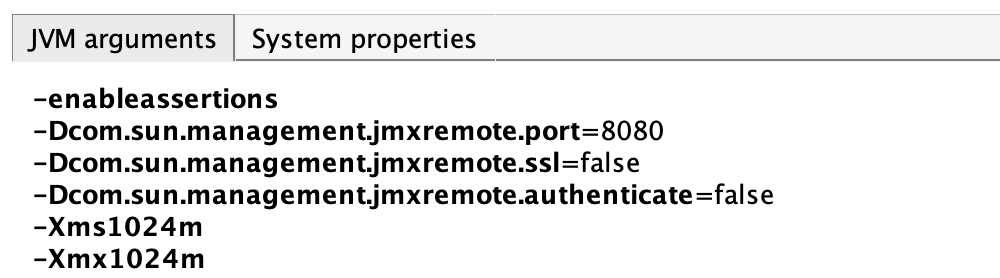
as suggested but the Threads still didn’t show up. The threads view did show for the local applications. Maybe I’ll fix it in time. Until then…
Troubleshooting
You can find VisualVM logs by going to Visual VM -> About Visual VM -> Logfile on the Mac. It can take a while to load. The logfile location on my Mac is $HOME/Library/Application Support/VisualVM/2.1.4/var/log/messages.log.
