
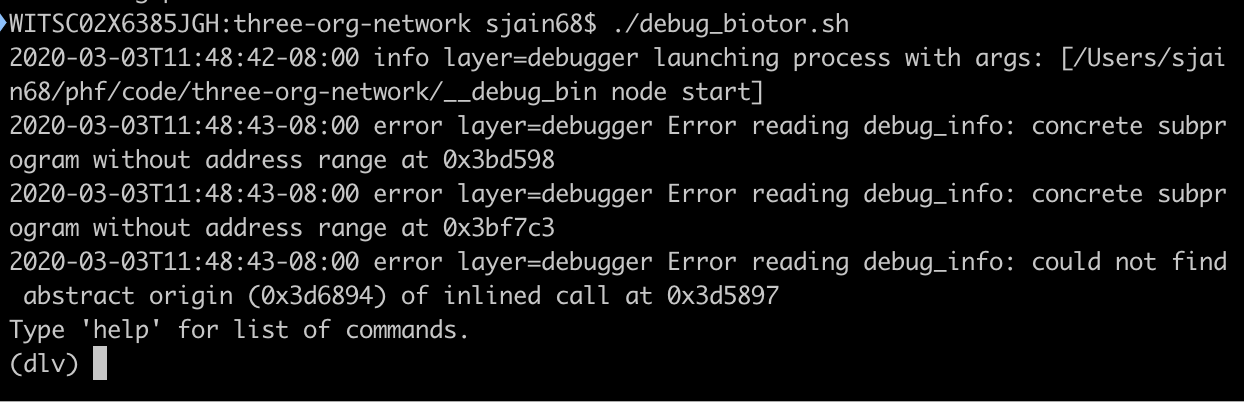
This post contains some notes on how to debug Hyperledger Fabric codebase that is written in Go. It is not meant to be an exhaustive tutorial and there can be gaps in documentation. The intent is to capture some notes that may be useful later on. First step is to clone the Fabric repository. Then install Go and Delve. After that a debug session can be started like

this gave me
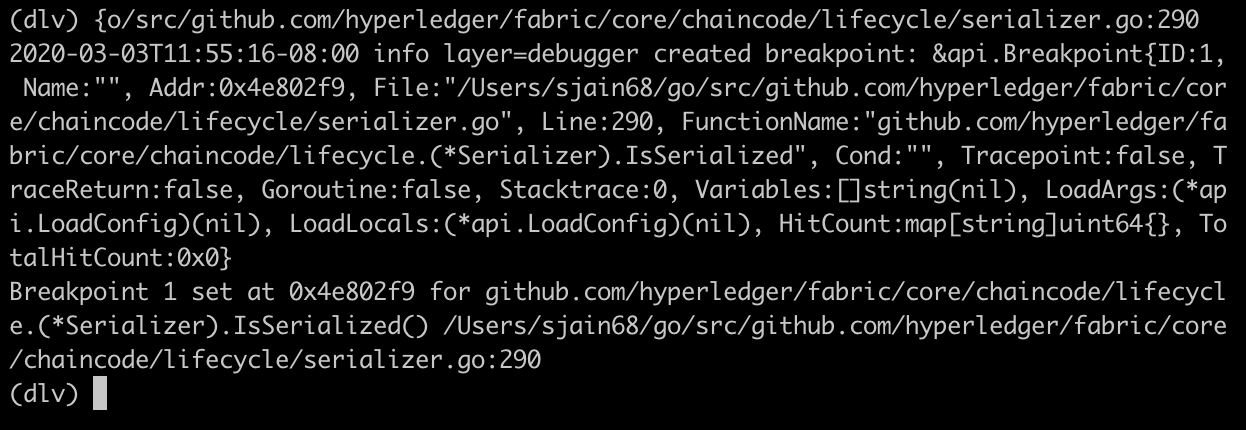
Next I wanted to stick a breakpoint in https://github.com/hyperledger/fabric/blob/release-2.0/core/chaincode/lifecycle/serializer.go#L290.

To do that enter
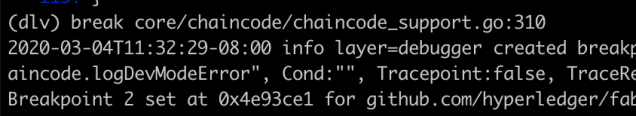
break <filename>:<line>
as shown below
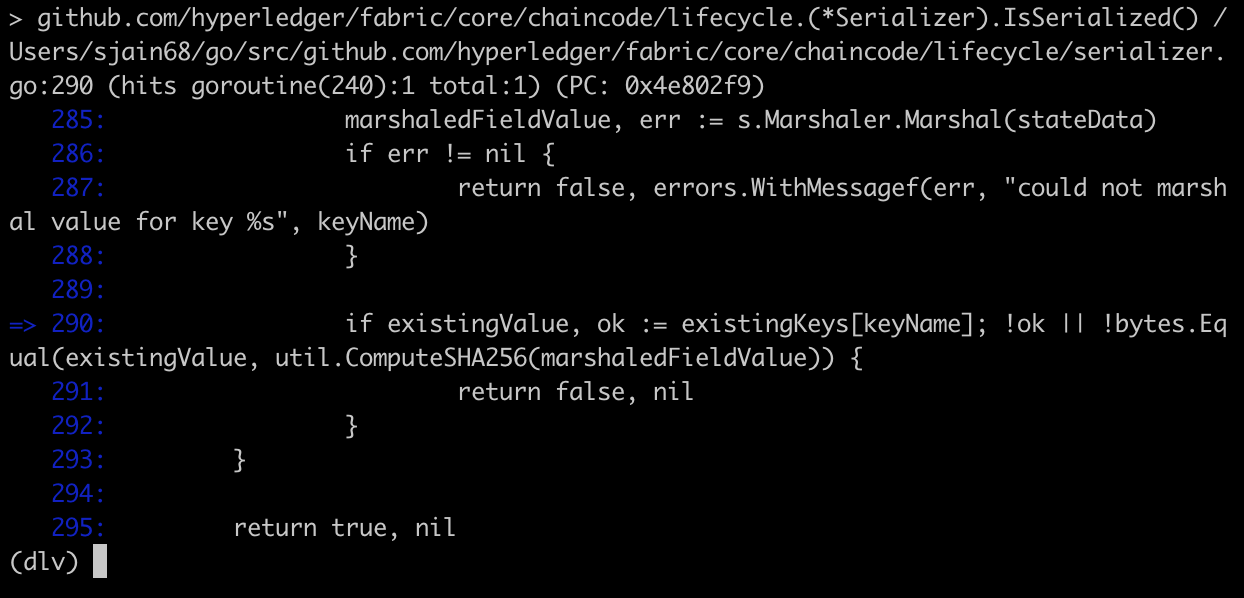
then enter continue to continue the execution i.e.,
(dlv) continue
below is screenshot when breakpoint is hit
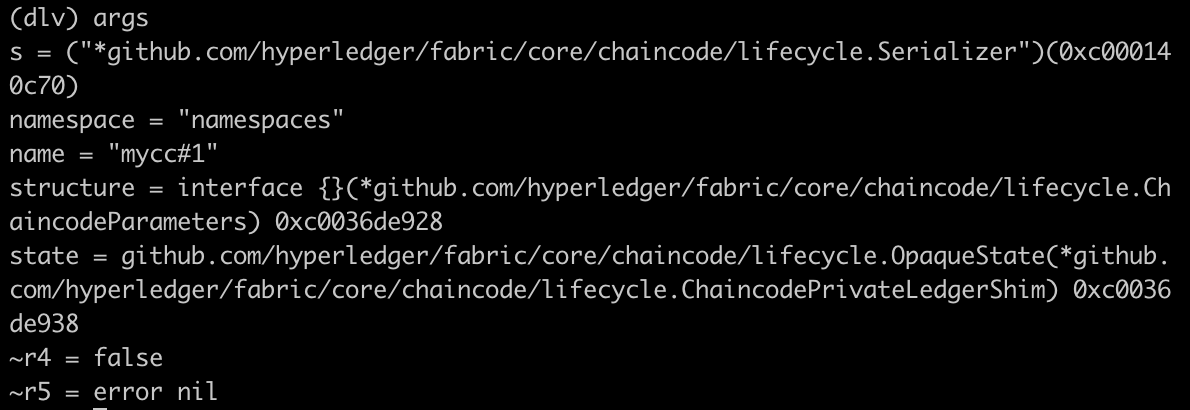
we can see the arguments passed to the function by typing args
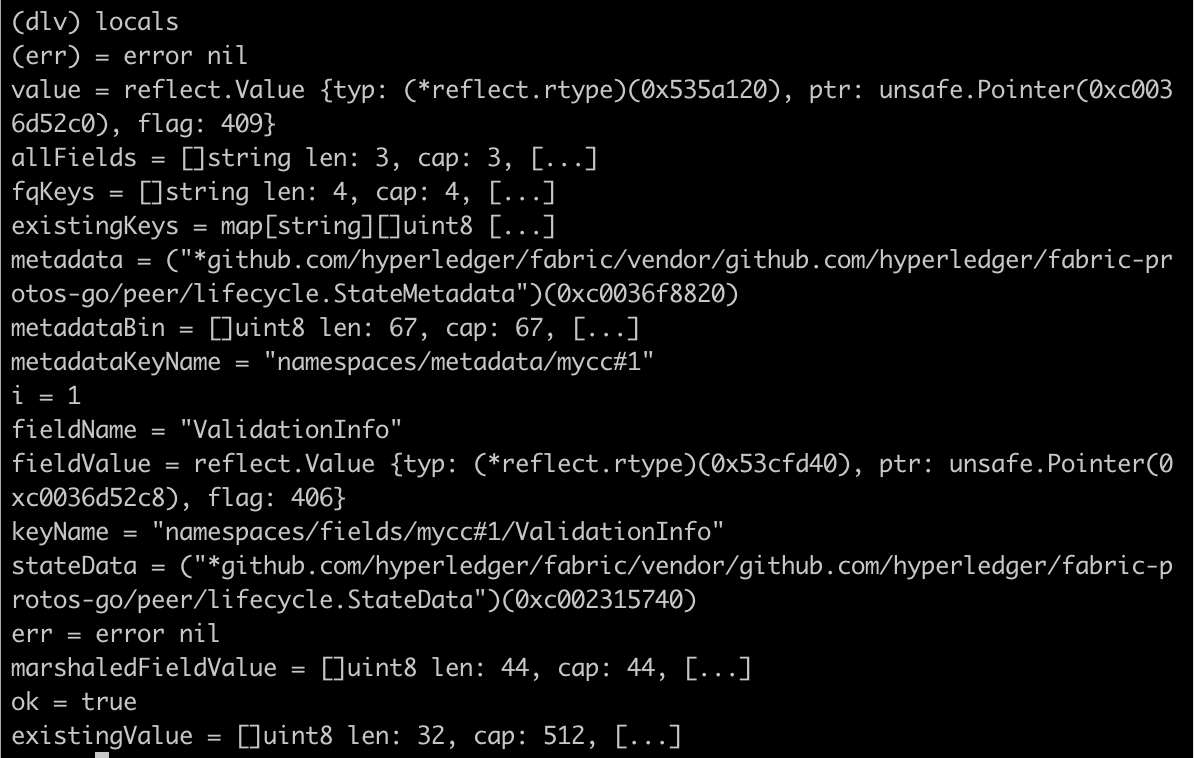
we can see the local variables by typing locals
we can inspect a variable using the print command
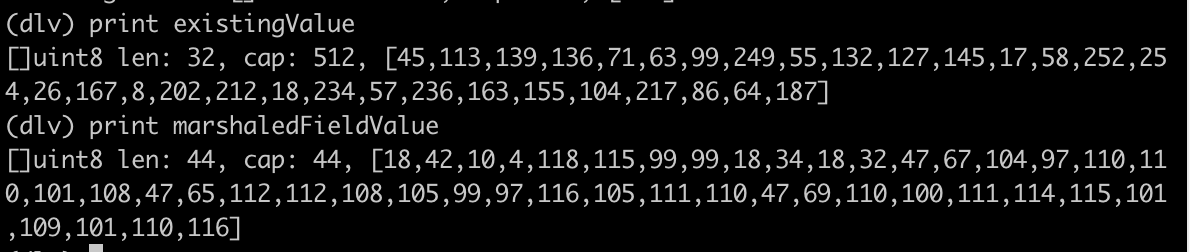
the print command cannot evaluate function calls. it can only inspect things that have been evaluated and are sitting in memory. One problem you might run into is that print truncates the output and limits the display of long strings to 64 characters or so. To display more than 64 characters use the slice operation as described here.
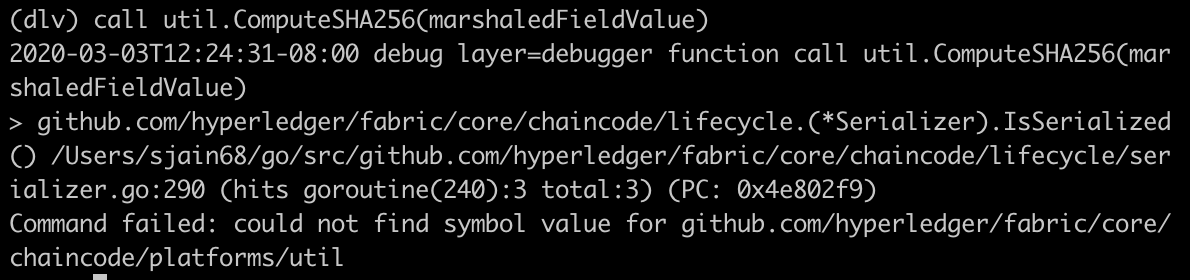
It looks like there is no way to evaluate function calls. There is a command call but its experimental and note that it resumes execution of the code so be careful when trying to use it. when I tried it I got error
https://github.com/go-delve/delve/issues/1910
you can check where you are at any point by using list command
and you can move to next line by using next command
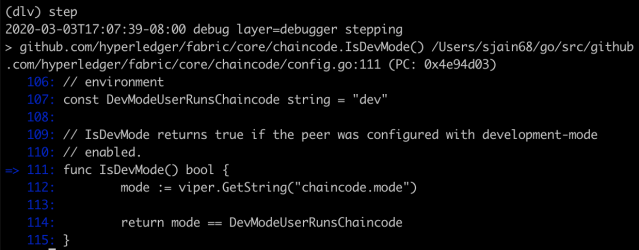
To step into a function use the step command. E.g., in below we are at
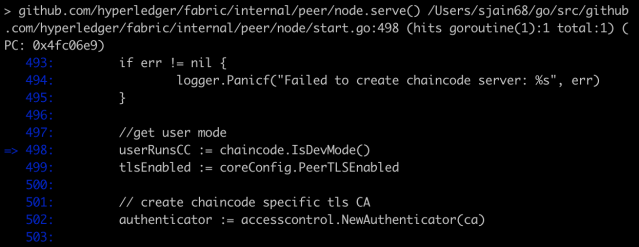
and running step will step into the function IsDevMode as shown below
Use stepout to step out of a function
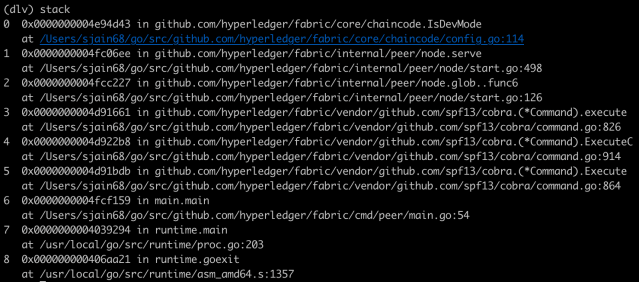
to see the current callstack use the stack command
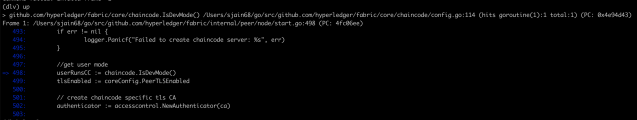
To move down the stack use the up command (yes its not a typo)
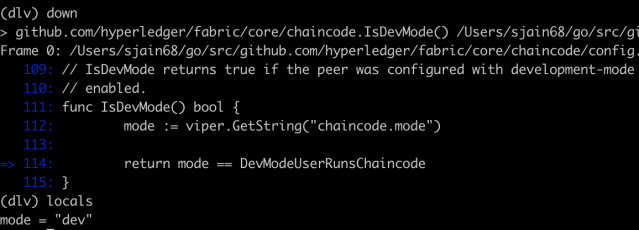
and to move up the stack use the down command
we can use git grep -n command to search for some string in the codebase. E.g.:
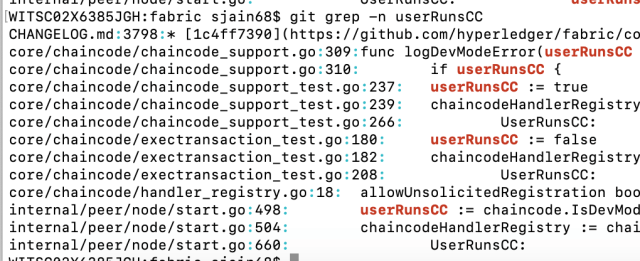
and then we can use break to insert breakpoints at those lines. E.g.:
To see all your breakpoints use the breakpoints command
To exit the debugger use exit
To recap, we covered following functions of delve. This should be enough for most of your debugging needs.
- break
- breakpoints
- continue
- list
- next
- step
- stepout
- locals
- args
- stack
- up
- down
- exit
 |
could not find symbol value for github.com/hyperledger/fabric/core/chaincode/platforms/util · Issue #1910 · go-delve/delve What version of Delve are you using (dlv version)? $ dlv version Delve Debugger Version: 1.3.2 Build: $Id: 569ccbd514fc47c8b4c521b142556867ec5e6917 What version of Go are you using? (go version)? $… github.com |
reference: https://github.com/go-delve/delve/tree/master/Documentation/cli
|
delve/Documentation/cli at master · go-delve/delve · GitHub Adds an optional scope prefix to the `regs` command which allows printing registers for any stack frame (as long as they were somehow saved). Issue #1838 is not yet to be closed since we are still not recovering the registers of a segfaulting frame. Updates #1838 github.com |
