create training data:
n=10000
x=runif(n)
y=runif(n)
df=data.frame(x,y,as.factor(x>y))
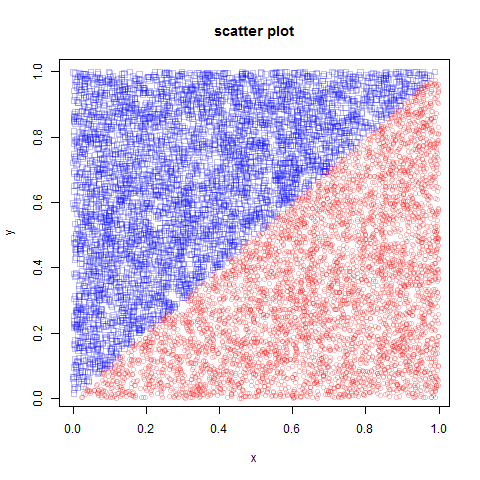
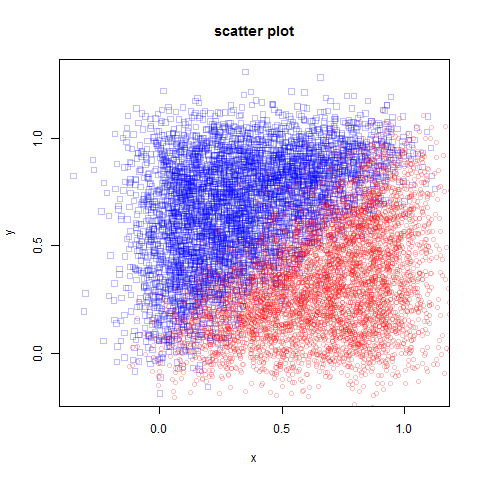
visualize:
colors = list(rgb(0,0,1,1/4),rgb(1,0,0,1/4))
names(df) = c("x", "y", "class")
classes=levels(df[[3]])
obs1=as.matrix(subset(df,class==classes[[1]])[,1:2])
obs2=as.matrix(subset(df,class==classes[[2]])[,1:2])
# make scatter plot
dev.new()
plot(obs1[,1],obs1[,2],xlab="x",ylab="y",main="scatter plot",pch=0,col=colors[[1]])
points(obs2[,1],obs2[,2],xlab="x",ylab="y",main="scatter plot",pch=1,col=colors[[2]])
result:
D = \frac{|\mu_1-\mu_2|}{\sigma_1+\sigma_2}:
> Dp
        x         y
0.7121875 0.7208857
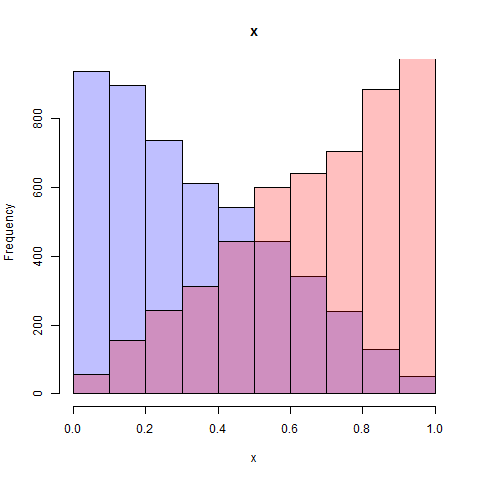
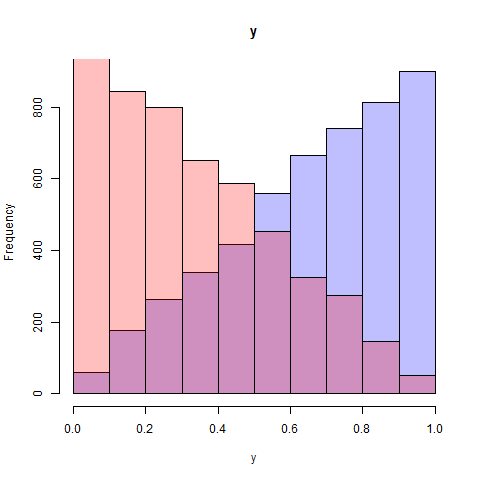
histograms of x and y:
build classifier:
model=glm(class~.,family="binomial",data=df)
summary(model) # prints summary
Output:
Call:
glm(formula = class ~ ., family = "binomial", data = df)

Deviance Residuals:
     Min        1Q    Median        3Q       Max
-0.11832   0.00000   0.00000   0.00000   0.08847

Coefficients:
              Estimate Std. Error z value Pr(>|z|)
(Intercept)  5.765e-01  1.923e+01   0.030    0.976
feature1     9.761e+04  8.981e+04   1.087    0.277
feature2    -9.761e+04  8.981e+04  -1.087    0.277

(Dispersion parameter for binomial family taken to be 1)

    Null deviance: 1.3863e+04  on 9999  degrees of freedom
Residual deviance: 2.9418e-02  on 9997  degrees of freedom
AIC: 6.0294

Number of Fisher Scoring iterations: 25
algorithm fails to converge because of perfect separation:
Warning messages:
1: glm.fit: algorithm did not converge
2: glm.fit: fitted probabilities numerically 0 or 1 occurred
compute AUC:
response=predict(model,type="response")
groundTruth=df[,3]
M=NULL
for (threshold in seq(0.05,0.95,0.05))
{
	M=cbind(M,calc(response,groundTruth,classes,threshold))
}
M = cbind(c(1,1),M,c(0,0))
fp = M[1,]
tp = M[2,]
auc = -auc(fp, tp)
where:
auc=function(x,y)
{
	d = diff(x, 1)
	e = as.numeric(lapply(1:(length(y)-1), function(i)y[i]+y[i+1]))
	return(sum(0.5*d*e))
}

calc=function(response, groundTruth, classes, threshold)
{
	type1 = classes[1]
	type2 = classes[2]
	n=length(response)
	predicted = as.factor(ifelse(response<threshold,type1,type2))
	I = which(groundTruth==type1)
	fp = length(which(predicted[I] != type1)) / length(I)
	I = which(groundTruth==type2)
	tp = length(which(predicted[I] == type2)) / length(I)
	return(c(fp,tp))
}
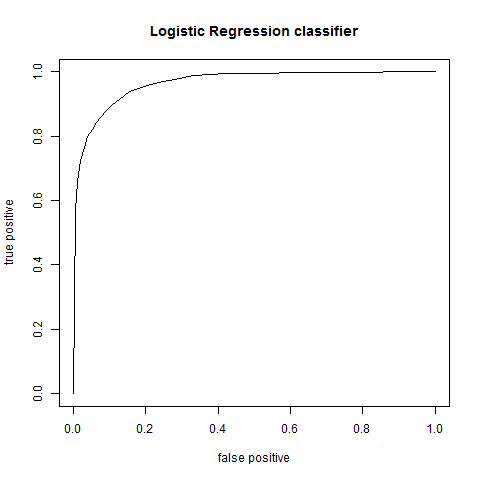
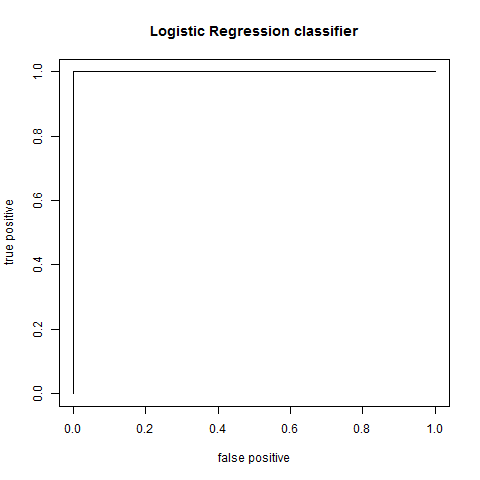
plot AUC:
plot(fp,tp,type="l",xlab="false positive",ylab="true positive",main="Logistic Regression classifier")
result:
LDA:
lda_classifier=lda(class~., data=df)
Call:
lda(class ~ ., data = df)

Prior probabilities of groups:
 FALSE   TRUE
0.5007 0.4993

Group means:
       feature1  feature2
FALSE 0.3346288 0.6676169
TRUE  0.6710111 0.3380432

Coefficients of linear discriminants:
               LD1
**feature1  4.280490
feature2 -4.196388**
finally you add add some noise to make logistic regression converge:
df=data.frame(x+rnorm(n,sd=0.1),y+rnorm(n,sd=0.1),as.factor(x>y))
scatter plot:
ROC: